Pueblo vs Brazilian Cognitive Disability
COMPARE
Pueblo
Brazilian
Cognitive Disability
Cognitive Disability Comparison
Pueblo
Brazilians
18.7%
COGNITIVE DISABILITY
0.0/ 100
METRIC RATING
323rd/ 347
METRIC RANK
17.1%
COGNITIVE DISABILITY
78.9/ 100
METRIC RATING
155th/ 347
METRIC RANK
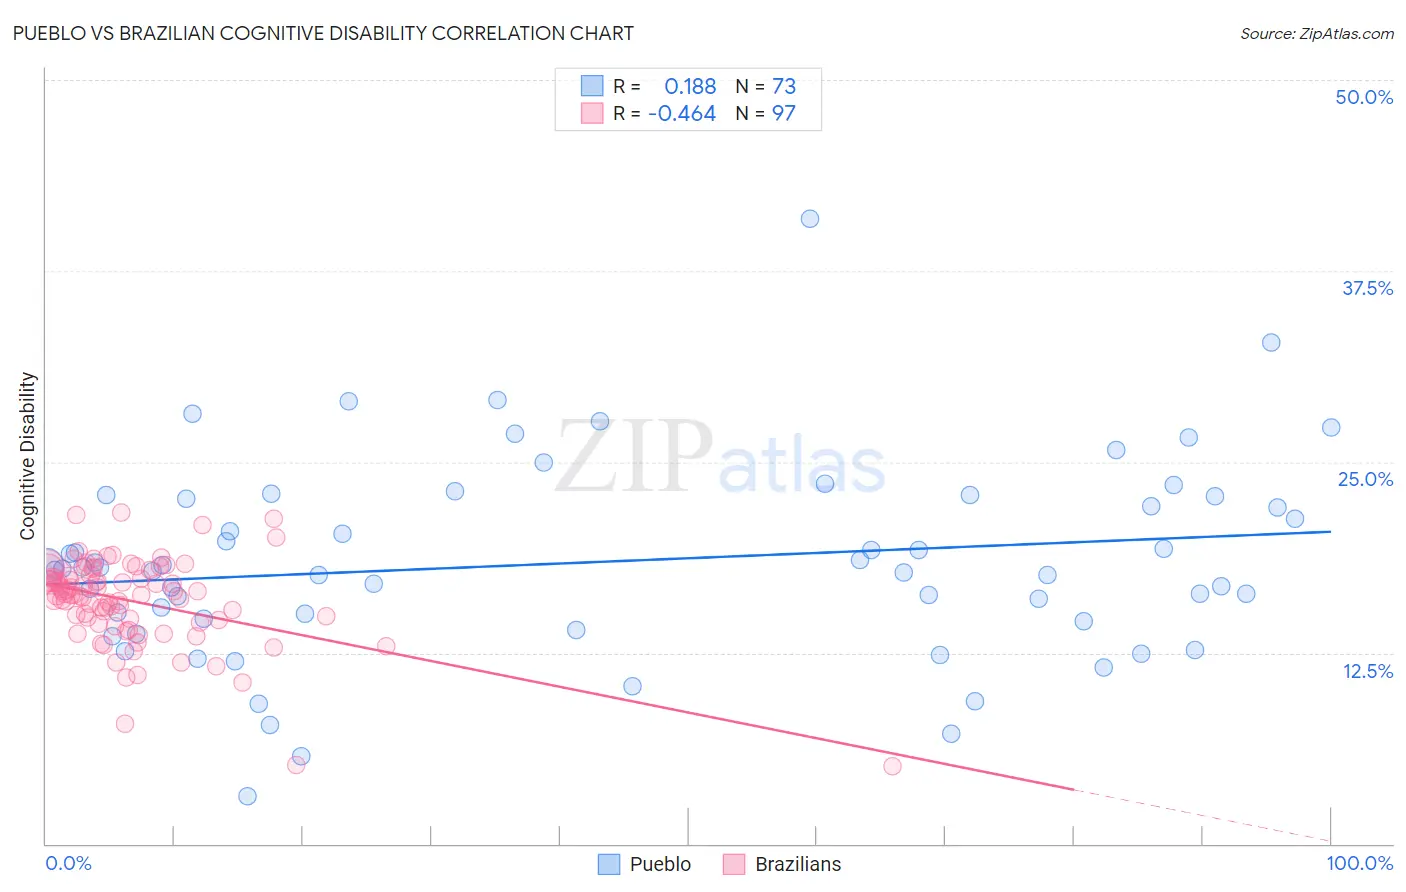
Pueblo vs Brazilian Cognitive Disability Correlation Chart
The statistical analysis conducted on geographies consisting of 120,078,702 people shows a poor positive correlation between the proportion of Pueblo and percentage of population with cognitive disability in the United States with a correlation coefficient (R) of 0.188 and weighted average of 18.7%. Similarly, the statistical analysis conducted on geographies consisting of 323,952,153 people shows a moderate negative correlation between the proportion of Brazilians and percentage of population with cognitive disability in the United States with a correlation coefficient (R) of -0.464 and weighted average of 17.1%, a difference of 9.0%.
Cognitive Disability Correlation Summary
| Measurement | Pueblo | Brazilian |
| Minimum | 3.1% | 5.1% |
| Maximum | 40.9% | 21.7% |
| Range | 37.7% | 16.6% |
| Mean | 18.4% | 15.9% |
| Median | 18.0% | 16.3% |
| Interquartile 25% (IQ1) | 14.7% | 14.6% |
| Interquartile 75% (IQ3) | 22.7% | 17.5% |
| Interquartile Range (IQR) | 8.0% | 2.9% |
| Standard Deviation (Sample) | 6.4% | 2.9% |
| Standard Deviation (Population) | 6.3% | 2.9% |
Similar Demographics by Cognitive Disability
Demographics Similar to Pueblo by Cognitive Disability
In terms of cognitive disability, the demographic groups most similar to Pueblo are Immigrants from Liberia (18.7%, a difference of 0.020%), African (18.6%, a difference of 0.080%), Dominican (18.7%, a difference of 0.12%), Apache (18.6%, a difference of 0.17%), and Indonesian (18.7%, a difference of 0.20%).
| Demographics | Rating | Rank | Cognitive Disability |
| Immigrants | Middle Africa | 0.0 /100 | #316 | Tragic 18.6% |
| Liberians | 0.0 /100 | #317 | Tragic 18.6% |
| Bangladeshis | 0.0 /100 | #318 | Tragic 18.6% |
| Comanche | 0.0 /100 | #319 | Tragic 18.6% |
| Apache | 0.0 /100 | #320 | Tragic 18.6% |
| Africans | 0.0 /100 | #321 | Tragic 18.6% |
| Immigrants | Liberia | 0.0 /100 | #322 | Tragic 18.7% |
| Pueblo | 0.0 /100 | #323 | Tragic 18.7% |
| Dominicans | 0.0 /100 | #324 | Tragic 18.7% |
| Indonesians | 0.0 /100 | #325 | Tragic 18.7% |
| Immigrants | Senegal | 0.0 /100 | #326 | Tragic 18.7% |
| U.S. Virgin Islanders | 0.0 /100 | #327 | Tragic 18.7% |
| Kiowa | 0.0 /100 | #328 | Tragic 18.7% |
| Navajo | 0.0 /100 | #329 | Tragic 18.8% |
| Immigrants | Dominican Republic | 0.0 /100 | #330 | Tragic 18.8% |
Demographics Similar to Brazilians by Cognitive Disability
In terms of cognitive disability, the demographic groups most similar to Brazilians are Sri Lankan (17.1%, a difference of 0.0%), Immigrants from Malaysia (17.1%, a difference of 0.020%), Immigrants from Kazakhstan (17.1%, a difference of 0.070%), Immigrants from Australia (17.1%, a difference of 0.12%), and Immigrants from Indonesia (17.1%, a difference of 0.17%).
| Demographics | Rating | Rank | Cognitive Disability |
| French Canadians | 85.7 /100 | #148 | Excellent 17.1% |
| Cypriots | 85.7 /100 | #149 | Excellent 17.1% |
| Basques | 85.5 /100 | #150 | Excellent 17.1% |
| Syrians | 83.0 /100 | #151 | Excellent 17.1% |
| Immigrants | Indonesia | 82.7 /100 | #152 | Excellent 17.1% |
| Immigrants | Kazakhstan | 80.5 /100 | #153 | Excellent 17.1% |
| Immigrants | Malaysia | 79.3 /100 | #154 | Good 17.1% |
| Brazilians | 78.9 /100 | #155 | Good 17.1% |
| Sri Lankans | 78.9 /100 | #156 | Good 17.1% |
| Immigrants | Australia | 76.0 /100 | #157 | Good 17.1% |
| Celtics | 74.1 /100 | #158 | Good 17.1% |
| Immigrants | Latvia | 73.2 /100 | #159 | Good 17.2% |
| Australians | 72.4 /100 | #160 | Good 17.2% |
| Americans | 72.2 /100 | #161 | Good 17.2% |
| Yugoslavians | 71.6 /100 | #162 | Good 17.2% |