Immigrants from Nicaragua vs Irish Disability Age Under 5
COMPARE
Immigrants from Nicaragua
Irish
Disability Age Under 5
Disability Age Under 5 Comparison
Immigrants from Nicaragua
Irish
1.2%
DISABILITY AGE UNDER 5
96.0/ 100
METRIC RATING
103rd/ 347
METRIC RANK
1.7%
DISABILITY AGE UNDER 5
0.0/ 100
METRIC RATING
318th/ 347
METRIC RANK
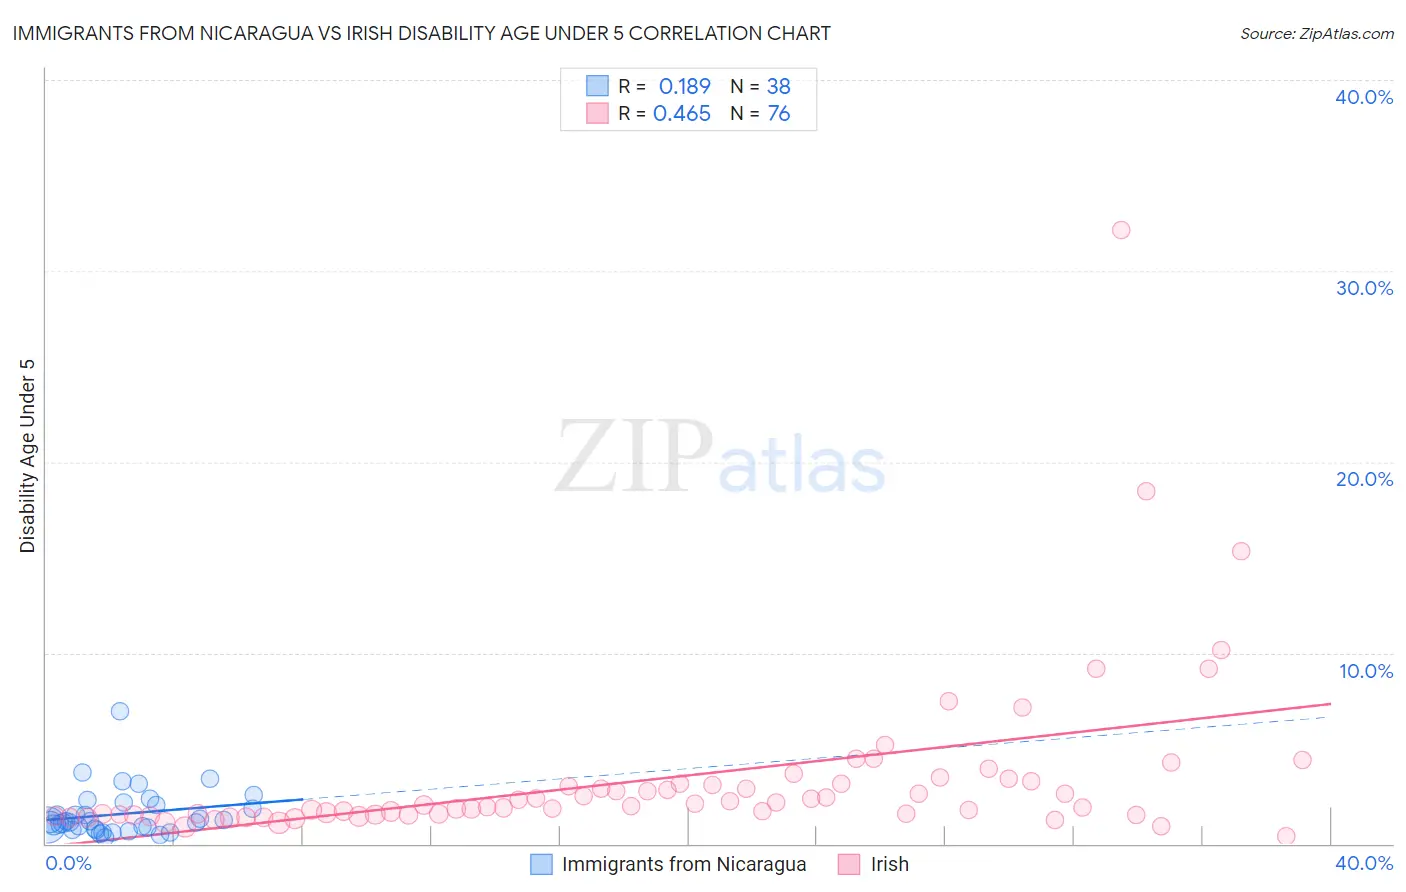
Immigrants from Nicaragua vs Irish Disability Age Under 5 Correlation Chart
The statistical analysis conducted on geographies consisting of 152,236,071 people shows a poor positive correlation between the proportion of Immigrants from Nicaragua and percentage of population with a disability under the age of 5 in the United States with a correlation coefficient (R) of 0.189 and weighted average of 1.2%. Similarly, the statistical analysis conducted on geographies consisting of 261,602,984 people shows a moderate positive correlation between the proportion of Irish and percentage of population with a disability under the age of 5 in the United States with a correlation coefficient (R) of 0.465 and weighted average of 1.7%, a difference of 47.3%.
Disability Age Under 5 Correlation Summary
| Measurement | Immigrants from Nicaragua | Irish |
| Minimum | 0.35% | 0.37% |
| Maximum | 6.9% | 32.1% |
| Range | 6.6% | 31.8% |
| Mean | 1.6% | 3.4% |
| Median | 1.1% | 2.0% |
| Interquartile 25% (IQ1) | 0.76% | 1.5% |
| Interquartile 75% (IQ3) | 2.1% | 3.2% |
| Interquartile Range (IQR) | 1.3% | 1.6% |
| Standard Deviation (Sample) | 1.3% | 4.5% |
| Standard Deviation (Population) | 1.2% | 4.4% |
Similar Demographics by Disability Age Under 5
Demographics Similar to Immigrants from Nicaragua by Disability Age Under 5
In terms of disability age under 5, the demographic groups most similar to Immigrants from Nicaragua are Immigrants from Morocco (1.2%, a difference of 0.0%), Immigrants from Uganda (1.1%, a difference of 0.060%), Indonesian (1.2%, a difference of 0.070%), Nicaraguan (1.1%, a difference of 0.17%), and Dominican (1.1%, a difference of 0.20%).
| Demographics | Rating | Rank | Disability Age Under 5 |
| Mongolians | 96.6 /100 | #96 | Exceptional 1.1% |
| Immigrants | Iraq | 96.5 /100 | #97 | Exceptional 1.1% |
| Immigrants | South Eastern Asia | 96.5 /100 | #98 | Exceptional 1.1% |
| Dominicans | 96.3 /100 | #99 | Exceptional 1.1% |
| Nicaraguans | 96.3 /100 | #100 | Exceptional 1.1% |
| Immigrants | Uganda | 96.1 /100 | #101 | Exceptional 1.1% |
| Immigrants | Morocco | 96.0 /100 | #102 | Exceptional 1.2% |
| Immigrants | Nicaragua | 96.0 /100 | #103 | Exceptional 1.2% |
| Indonesians | 95.9 /100 | #104 | Exceptional 1.2% |
| Immigrants | South Africa | 95.6 /100 | #105 | Exceptional 1.2% |
| Cambodians | 95.4 /100 | #106 | Exceptional 1.2% |
| Immigrants | West Indies | 95.3 /100 | #107 | Exceptional 1.2% |
| Iraqis | 95.1 /100 | #108 | Exceptional 1.2% |
| Immigrants | Panama | 95.0 /100 | #109 | Exceptional 1.2% |
| Immigrants | Lebanon | 95.0 /100 | #110 | Exceptional 1.2% |
Demographics Similar to Irish by Disability Age Under 5
In terms of disability age under 5, the demographic groups most similar to Irish are French (1.7%, a difference of 0.27%), Slovak (1.7%, a difference of 0.31%), Immigrants from Cabo Verde (1.7%, a difference of 0.69%), Scotch-Irish (1.7%, a difference of 0.84%), and Dutch (1.7%, a difference of 0.88%).
| Demographics | Rating | Rank | Disability Age Under 5 |
| English | 0.0 /100 | #311 | Tragic 1.7% |
| Puerto Ricans | 0.0 /100 | #312 | Tragic 1.7% |
| Celtics | 0.0 /100 | #313 | Tragic 1.7% |
| Norwegians | 0.0 /100 | #314 | Tragic 1.7% |
| Dutch | 0.0 /100 | #315 | Tragic 1.7% |
| Immigrants | Cabo Verde | 0.0 /100 | #316 | Tragic 1.7% |
| French | 0.0 /100 | #317 | Tragic 1.7% |
| Irish | 0.0 /100 | #318 | Tragic 1.7% |
| Slovaks | 0.0 /100 | #319 | Tragic 1.7% |
| Scotch-Irish | 0.0 /100 | #320 | Tragic 1.7% |
| Ottawa | 0.0 /100 | #321 | Tragic 1.7% |
| Germans | 0.0 /100 | #322 | Tragic 1.7% |
| Chickasaw | 0.0 /100 | #323 | Tragic 1.7% |
| Cherokee | 0.0 /100 | #324 | Tragic 1.8% |
| Immigrants | Portugal | 0.0 /100 | #325 | Tragic 1.8% |