Immigrants from the Azores vs Irish Disability Age Under 5
COMPARE
Immigrants from the Azores
Irish
Disability Age Under 5
Disability Age Under 5 Comparison
Immigrants from the Azores
Irish
2.2%
DISABILITY AGE UNDER 5
0.0/ 100
METRIC RATING
339th/ 347
METRIC RANK
1.7%
DISABILITY AGE UNDER 5
0.0/ 100
METRIC RATING
318th/ 347
METRIC RANK
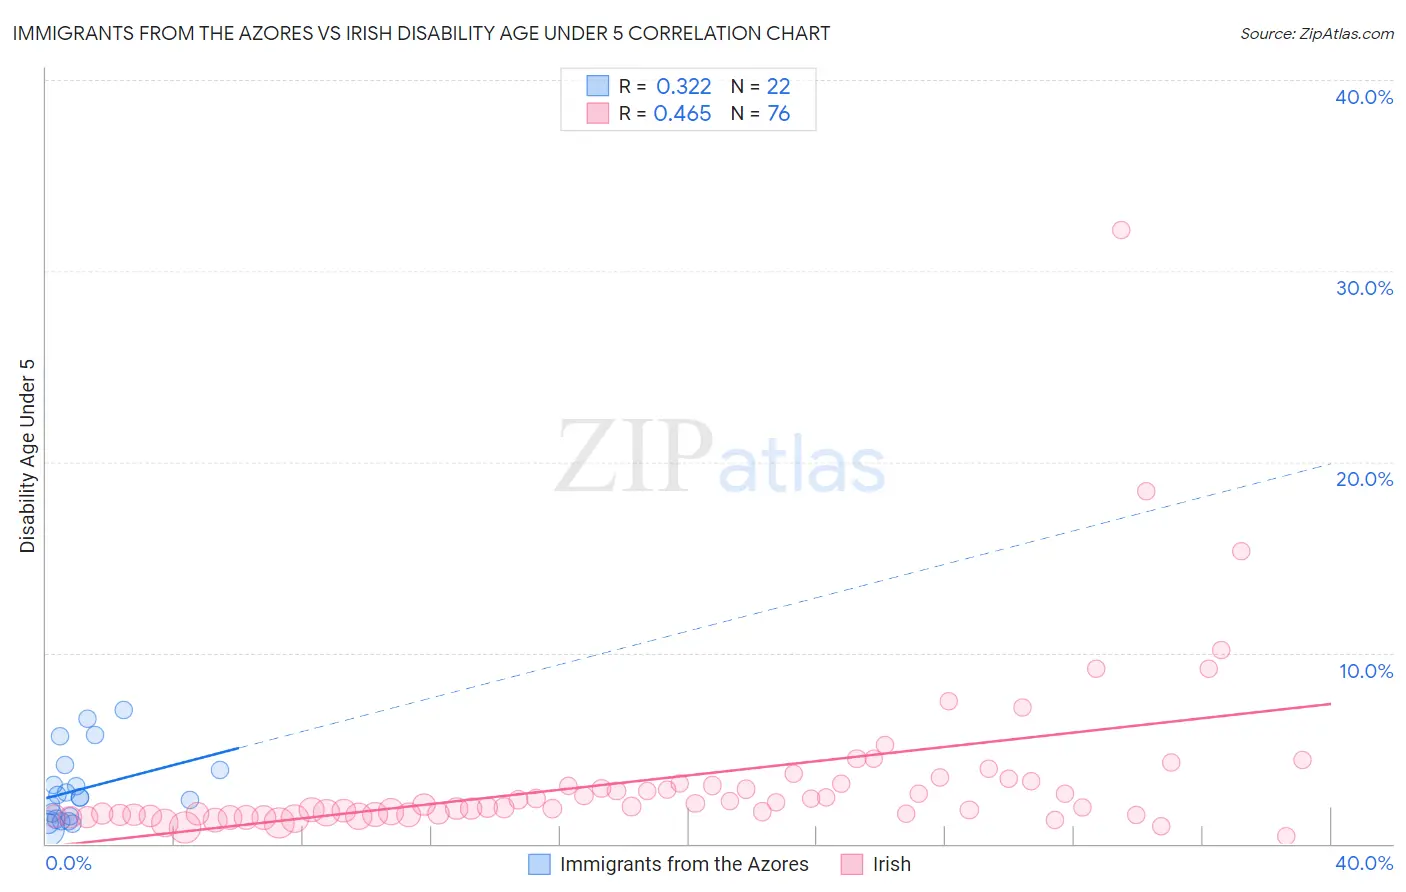
Immigrants from the Azores vs Irish Disability Age Under 5 Correlation Chart
The statistical analysis conducted on geographies consisting of 32,548,094 people shows a mild positive correlation between the proportion of Immigrants from the Azores and percentage of population with a disability under the age of 5 in the United States with a correlation coefficient (R) of 0.322 and weighted average of 2.2%. Similarly, the statistical analysis conducted on geographies consisting of 261,602,984 people shows a moderate positive correlation between the proportion of Irish and percentage of population with a disability under the age of 5 in the United States with a correlation coefficient (R) of 0.465 and weighted average of 1.7%, a difference of 31.8%.
Disability Age Under 5 Correlation Summary
| Measurement | Immigrants from the Azores | Irish |
| Minimum | 0.81% | 0.37% |
| Maximum | 7.0% | 32.1% |
| Range | 6.2% | 31.8% |
| Mean | 2.9% | 3.4% |
| Median | 2.4% | 2.0% |
| Interquartile 25% (IQ1) | 1.3% | 1.5% |
| Interquartile 75% (IQ3) | 3.8% | 3.2% |
| Interquartile Range (IQR) | 2.6% | 1.6% |
| Standard Deviation (Sample) | 1.9% | 4.5% |
| Standard Deviation (Population) | 1.8% | 4.4% |
Similar Demographics by Disability Age Under 5
Demographics Similar to Immigrants from the Azores by Disability Age Under 5
In terms of disability age under 5, the demographic groups most similar to Immigrants from the Azores are Tohono O'odham (2.2%, a difference of 2.2%), Menominee (2.3%, a difference of 2.8%), Tsimshian (2.4%, a difference of 7.8%), Apache (2.0%, a difference of 10.0%), and Paraguayan (2.0%, a difference of 13.2%).
| Demographics | Rating | Rank | Disability Age Under 5 |
| Chippewa | 0.0 /100 | #332 | Tragic 1.9% |
| Dutch West Indians | 0.0 /100 | #333 | Tragic 1.9% |
| Natives/Alaskans | 0.0 /100 | #334 | Tragic 1.9% |
| Pennsylvania Germans | 0.0 /100 | #335 | Tragic 1.9% |
| Paraguayans | 0.0 /100 | #336 | Tragic 2.0% |
| Apache | 0.0 /100 | #337 | Tragic 2.0% |
| Tohono O'odham | 0.0 /100 | #338 | Tragic 2.2% |
| Immigrants | Azores | 0.0 /100 | #339 | Tragic 2.2% |
| Menominee | 0.0 /100 | #340 | Tragic 2.3% |
| Tsimshian | 0.0 /100 | #341 | Tragic 2.4% |
| Alaska Natives | 0.0 /100 | #342 | Tragic 2.9% |
| Colville | 0.0 /100 | #343 | Tragic 3.3% |
| Inupiat | 0.0 /100 | #344 | Tragic 3.7% |
| Paiute | 0.0 /100 | #345 | Tragic 3.9% |
| Yup'ik | 0.0 /100 | #346 | Tragic 4.5% |
Demographics Similar to Irish by Disability Age Under 5
In terms of disability age under 5, the demographic groups most similar to Irish are French (1.7%, a difference of 0.27%), Slovak (1.7%, a difference of 0.31%), Immigrants from Cabo Verde (1.7%, a difference of 0.69%), Scotch-Irish (1.7%, a difference of 0.84%), and Dutch (1.7%, a difference of 0.88%).
| Demographics | Rating | Rank | Disability Age Under 5 |
| English | 0.0 /100 | #311 | Tragic 1.7% |
| Puerto Ricans | 0.0 /100 | #312 | Tragic 1.7% |
| Celtics | 0.0 /100 | #313 | Tragic 1.7% |
| Norwegians | 0.0 /100 | #314 | Tragic 1.7% |
| Dutch | 0.0 /100 | #315 | Tragic 1.7% |
| Immigrants | Cabo Verde | 0.0 /100 | #316 | Tragic 1.7% |
| French | 0.0 /100 | #317 | Tragic 1.7% |
| Irish | 0.0 /100 | #318 | Tragic 1.7% |
| Slovaks | 0.0 /100 | #319 | Tragic 1.7% |
| Scotch-Irish | 0.0 /100 | #320 | Tragic 1.7% |
| Ottawa | 0.0 /100 | #321 | Tragic 1.7% |
| Germans | 0.0 /100 | #322 | Tragic 1.7% |
| Chickasaw | 0.0 /100 | #323 | Tragic 1.7% |
| Cherokee | 0.0 /100 | #324 | Tragic 1.8% |
| Immigrants | Portugal | 0.0 /100 | #325 | Tragic 1.8% |