Cheyenne vs Immigrants from Germany Self-Care Disability
COMPARE
Cheyenne
Immigrants from Germany
Self-Care Disability
Self-Care Disability Comparison
Cheyenne
Immigrants from Germany
2.6%
SELF-CARE DISABILITY
0.6/ 100
METRIC RATING
246th/ 347
METRIC RANK
2.5%
SELF-CARE DISABILITY
17.9/ 100
METRIC RATING
194th/ 347
METRIC RANK
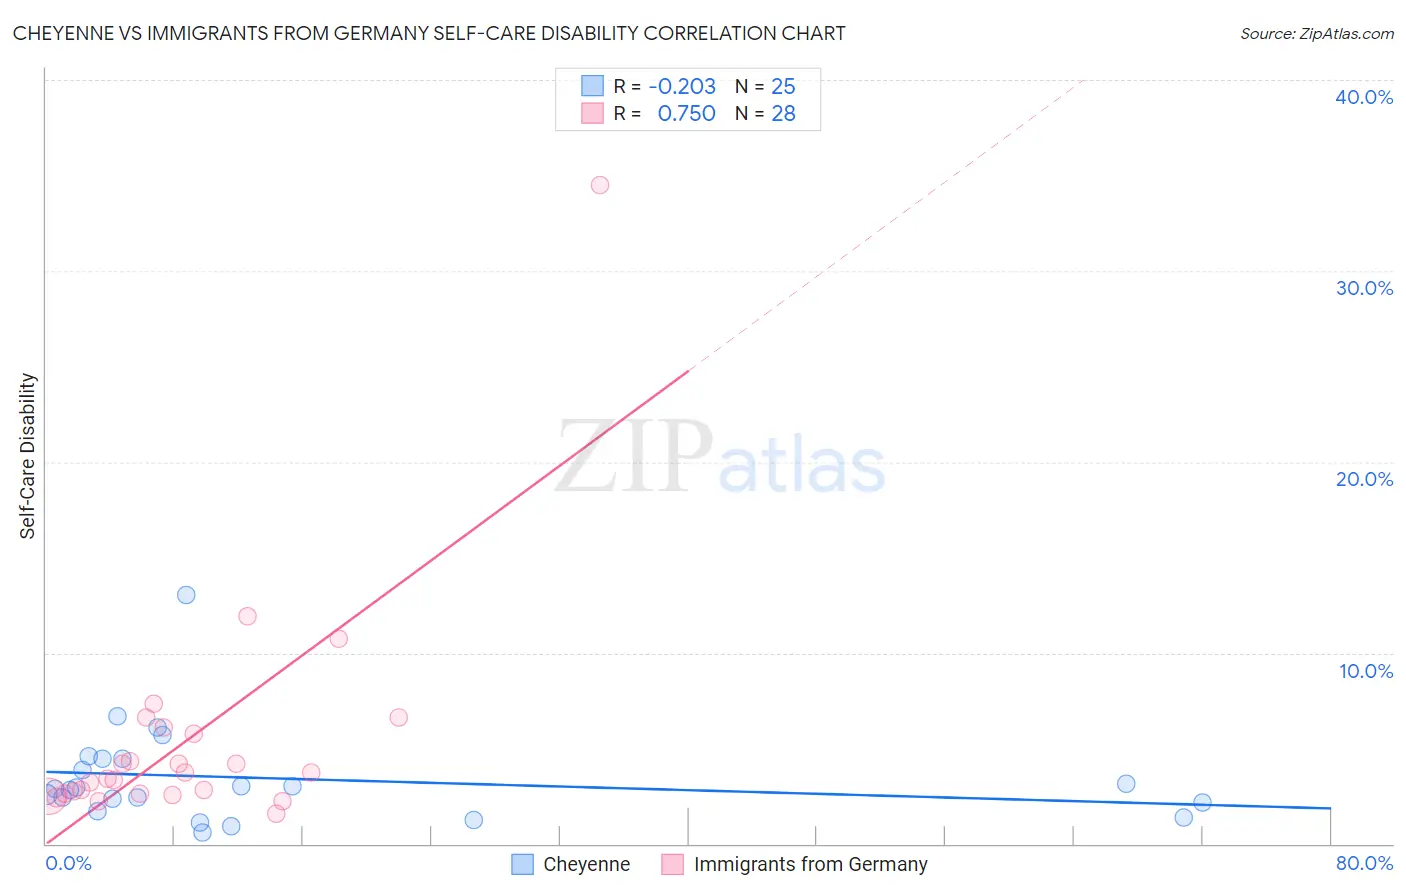
Cheyenne vs Immigrants from Germany Self-Care Disability Correlation Chart
The statistical analysis conducted on geographies consisting of 80,691,383 people shows a weak negative correlation between the proportion of Cheyenne and percentage of population with self-care disability in the United States with a correlation coefficient (R) of -0.203 and weighted average of 2.6%. Similarly, the statistical analysis conducted on geographies consisting of 463,338,664 people shows a strong positive correlation between the proportion of Immigrants from Germany and percentage of population with self-care disability in the United States with a correlation coefficient (R) of 0.750 and weighted average of 2.5%, a difference of 4.1%.
Self-Care Disability Correlation Summary
| Measurement | Cheyenne | Immigrants from Germany |
| Minimum | 0.57% | 1.6% |
| Maximum | 13.0% | 34.5% |
| Range | 12.5% | 32.9% |
| Mean | 3.4% | 5.4% |
| Median | 2.9% | 3.6% |
| Interquartile 25% (IQ1) | 1.9% | 2.6% |
| Interquartile 75% (IQ3) | 4.5% | 5.9% |
| Interquartile Range (IQR) | 2.5% | 3.3% |
| Standard Deviation (Sample) | 2.6% | 6.2% |
| Standard Deviation (Population) | 2.5% | 6.1% |
Similar Demographics by Self-Care Disability
Demographics Similar to Cheyenne by Self-Care Disability
In terms of self-care disability, the demographic groups most similar to Cheyenne are Immigrants from Western Asia (2.6%, a difference of 0.020%), Immigrants from Albania (2.6%, a difference of 0.13%), Nicaraguan (2.6%, a difference of 0.13%), Yuman (2.6%, a difference of 0.21%), and Hawaiian (2.6%, a difference of 0.25%).
| Demographics | Rating | Rank | Self-Care Disability |
| Immigrants | Panama | 1.2 /100 | #239 | Tragic 2.6% |
| Marshallese | 1.2 /100 | #240 | Tragic 2.6% |
| Immigrants | Syria | 1.0 /100 | #241 | Tragic 2.6% |
| Spanish | 0.8 /100 | #242 | Tragic 2.6% |
| Hawaiians | 0.8 /100 | #243 | Tragic 2.6% |
| Yuman | 0.8 /100 | #244 | Tragic 2.6% |
| Immigrants | Western Asia | 0.6 /100 | #245 | Tragic 2.6% |
| Cheyenne | 0.6 /100 | #246 | Tragic 2.6% |
| Immigrants | Albania | 0.6 /100 | #247 | Tragic 2.6% |
| Nicaraguans | 0.6 /100 | #248 | Tragic 2.6% |
| Mexican American Indians | 0.5 /100 | #249 | Tragic 2.6% |
| Portuguese | 0.4 /100 | #250 | Tragic 2.6% |
| Immigrants | Liberia | 0.4 /100 | #251 | Tragic 2.6% |
| Immigrants | Bangladesh | 0.4 /100 | #252 | Tragic 2.6% |
| Immigrants | Haiti | 0.3 /100 | #253 | Tragic 2.6% |
Demographics Similar to Immigrants from Germany by Self-Care Disability
In terms of self-care disability, the demographic groups most similar to Immigrants from Germany are Immigrants from Southern Europe (2.5%, a difference of 0.19%), Korean (2.5%, a difference of 0.20%), Crow (2.5%, a difference of 0.23%), Immigrants (2.5%, a difference of 0.25%), and Ukrainian (2.5%, a difference of 0.26%).
| Demographics | Rating | Rank | Self-Care Disability |
| Irish | 28.7 /100 | #187 | Fair 2.5% |
| Immigrants | Oceania | 28.3 /100 | #188 | Fair 2.5% |
| Immigrants | Eastern Europe | 28.0 /100 | #189 | Fair 2.5% |
| Sioux | 24.6 /100 | #190 | Fair 2.5% |
| Moroccans | 22.9 /100 | #191 | Fair 2.5% |
| Soviet Union | 22.2 /100 | #192 | Fair 2.5% |
| Ukrainians | 21.4 /100 | #193 | Fair 2.5% |
| Immigrants | Germany | 17.9 /100 | #194 | Poor 2.5% |
| Immigrants | Southern Europe | 15.6 /100 | #195 | Poor 2.5% |
| Koreans | 15.5 /100 | #196 | Poor 2.5% |
| Crow | 15.2 /100 | #197 | Poor 2.5% |
| Immigrants | Immigrants | 15.0 /100 | #198 | Poor 2.5% |
| Immigrants | Ghana | 14.7 /100 | #199 | Poor 2.5% |
| Immigrants | Western Africa | 13.3 /100 | #200 | Poor 2.5% |
| Immigrants | South Eastern Asia | 12.9 /100 | #201 | Poor 2.5% |