Cheyenne vs Immigrants from Cameroon Self-Care Disability

COMPARE

Cheyenne
Race
Ancestry
AfghanAfricanAlaska NativeAlaskan AthabascanAlbanianAleutAlsatianAmericanApacheArabArapahoArgentineanArmenianAssyrian/Chaldean/SyriacAustralianAustrianBahamianBangladeshiBarbadianBasqueBelgianBelizeanBermudanBhutaneseBlackfeetBolivianBrazilianBritishBritish West IndianBulgarianBurmeseCajunCambodianCanadianCape VerdeanCarpatho RusynCelticCentral AmericanCentral American IndianCherokeeCheyenneChickasawChileanChineseChippewaChoctawColombianColvilleComancheCosta RicanCreeCreekCroatianCrowCubanCypriotCzechCzechoslovakianDanishDelawareDominicanDutchDutch West IndianEastern EuropeanEcuadorianEgyptianEnglishEstonianEthiopianEuropeanFijianFilipinoFinnishFrenchFrench American IndianFrench CanadianGermanGerman RussianGhanaianGreekGuamanian/ChamorroGuatemalanGuyaneseHaitianHmongHonduranHopiHoumaHungarianIcelanderIndian (Asian)IndonesianInupiatIranianIraqiIrishIroquoisIsraeliItalianJamaicanJapaneseJordanianKenyanKiowaKoreanLaotianLatvianLebaneseLiberianLithuanianLumbeeLuxembourgerMacedonianMalaysianMalteseMarshalleseMenomineeMexicanMexican American IndianMongolianMoroccanNative HawaiianNavajoNepaleseNew ZealanderNicaraguanNigerianNorthern EuropeanNorwegianOkinawanOsageOttawaPaiutePakistaniPalestinianPanamanianParaguayanPennsylvania GermanPeruvianPimaPolishPortuguesePotawatomiPuebloPuerto RicanPuget Sound SalishRomanianRussianSalvadoranSamoanScandinavianScotch-IrishScottishSeminoleSenegaleseSerbianShoshoneSierra LeoneanSiouxSlavicSlovakSloveneSomaliSouth AfricanSouth AmericanSouth American IndianSoviet UnionSpaniardSpanishSpanish AmericanSpanish American IndianSri LankanSubsaharan AfricanSudaneseSwedishSwissSyrianTaiwaneseThaiTlingit-HaidaTohono O'OdhamTonganTrinidadian and TobagonianTsimshianTurkishU.S. Virgin IslanderUgandanUkrainianUruguayanUteVenezuelanVietnameseWelshWest IndianYakamaYaquiYugoslavianYumanYup'ikZimbabwean
Immigration
NonimmigrantsImmigrantsAfghanistanAfricaAlbaniaArgentinaArmeniaAsiaAustraliaAustriaBahamasBangladeshBarbadosBelarusBelgiumBelizeBoliviaBosnia and HerzegovinaBrazilBulgariaBurma/MyanmarCabo VerdeCambodiaCanadaCaribbeanCentral AmericaChileChinaColombiaCongoCosta RicaCroatiaCubaCzechoslovakiaDenmarkDominicaDominican RepublicEastern AfricaEastern AsiaEastern EuropeEcuadorEgyptEl SalvadorEnglandEritreaEthiopiaEuropeFijiFranceGermanyGhanaGreeceGrenadaGuatemalaGuyanaHaitiHondurasHong KongHungaryIndiaIndonesiaIranIraqIrelandIsraelItalyJamaicaJapanJordanKazakhstanKenyaKoreaKuwaitLaosLatin AmericaLatviaLebanonLiberiaLithuaniaMalaysiaMexicoMicronesiaMiddle AfricaMoldovaMoroccoNepalNetherlandsNicaraguaNigeriaNorth AmericaNorth MacedoniaNorthern AfricaNorthern EuropeNorwayOceaniaPakistanPanamaPeruPhilippinesPolandPortugalRomaniaRussiaSaudi ArabiaScotlandSenegalSerbiaSierra LeoneSingaporeSomaliaSouth AfricaSouth AmericaSouth Central AsiaSouth Eastern AsiaSouthern EuropeSpainSri LankaSt. Vincent and the GrenadinesSudanSwedenSwitzerlandSyriaTaiwanThailandTrinidad and TobagoTurkeyUgandaUkraineUruguayUzbekistanVenezuelaVietnamWest IndiesWestern AfricaWestern AsiaWestern EuropeYemenZaireZimbabweAzores
Immigrants from Cameroon
Race
Ancestry
AfghanAfricanAlaska NativeAlaskan AthabascanAlbanianAleutAlsatianAmericanApacheArabArapahoArgentineanArmenianAssyrian/Chaldean/SyriacAustralianAustrianBahamianBangladeshiBarbadianBasqueBelgianBelizeanBermudanBhutaneseBlackfeetBolivianBrazilianBritishBritish West IndianBulgarianBurmeseCajunCambodianCanadianCape VerdeanCarpatho RusynCelticCentral AmericanCentral American IndianCherokeeChickasawChileanChineseChippewaChoctawColombianColvilleComancheCosta RicanCreeCreekCroatianCrowCubanCypriotCzechCzechoslovakianDanishDelawareDominicanDutchDutch West IndianEastern EuropeanEcuadorianEgyptianEnglishEstonianEthiopianEuropeanFijianFilipinoFinnishFrenchFrench American IndianFrench CanadianGermanGerman RussianGhanaianGreekGuamanian/ChamorroGuatemalanGuyaneseHaitianHmongHonduranHopiHoumaHungarianIcelanderIndian (Asian)IndonesianInupiatIranianIraqiIrishIroquoisIsraeliItalianJamaicanJapaneseJordanianKenyanKiowaKoreanLaotianLatvianLebaneseLiberianLithuanianLumbeeLuxembourgerMacedonianMalaysianMalteseMarshalleseMenomineeMexicanMexican American IndianMongolianMoroccanNative HawaiianNavajoNepaleseNew ZealanderNicaraguanNigerianNorthern EuropeanNorwegianOkinawanOsageOttawaPaiutePakistaniPalestinianPanamanianParaguayanPennsylvania GermanPeruvianPimaPolishPortuguesePotawatomiPuebloPuerto RicanPuget Sound SalishRomanianRussianSalvadoranSamoanScandinavianScotch-IrishScottishSeminoleSenegaleseSerbianShoshoneSierra LeoneanSiouxSlavicSlovakSloveneSomaliSouth AfricanSouth AmericanSouth American IndianSoviet UnionSpaniardSpanishSpanish AmericanSpanish American IndianSri LankanSubsaharan AfricanSudaneseSwedishSwissSyrianTaiwaneseThaiTlingit-HaidaTohono O'OdhamTonganTrinidadian and TobagonianTsimshianTurkishU.S. Virgin IslanderUgandanUkrainianUruguayanUteVenezuelanVietnameseWelshWest IndianYakamaYaquiYugoslavianYumanYup'ikZimbabwean
Immigration
NonimmigrantsImmigrantsAfghanistanAfricaAlbaniaArgentinaArmeniaAsiaAustraliaAustriaBahamasBangladeshBarbadosBelarusBelgiumBelizeBoliviaBosnia and HerzegovinaBrazilBulgariaBurma/MyanmarCabo VerdeCambodiaCameroonCanadaCaribbeanCentral AmericaChileChinaColombiaCongoCosta RicaCroatiaCubaCzechoslovakiaDenmarkDominicaDominican RepublicEastern AfricaEastern AsiaEastern EuropeEcuadorEgyptEl SalvadorEnglandEritreaEthiopiaEuropeFijiFranceGermanyGhanaGreeceGrenadaGuatemalaGuyanaHaitiHondurasHong KongHungaryIndiaIndonesiaIranIraqIrelandIsraelItalyJamaicaJapanJordanKazakhstanKenyaKoreaKuwaitLaosLatin AmericaLatviaLebanonLiberiaLithuaniaMalaysiaMexicoMicronesiaMiddle AfricaMoldovaMoroccoNepalNetherlandsNicaraguaNigeriaNorth AmericaNorth MacedoniaNorthern AfricaNorthern EuropeNorwayOceaniaPakistanPanamaPeruPhilippinesPolandPortugalRomaniaRussiaSaudi ArabiaScotlandSenegalSerbiaSierra LeoneSingaporeSomaliaSouth AfricaSouth AmericaSouth Central AsiaSouth Eastern AsiaSouthern EuropeSpainSri LankaSt. Vincent and the GrenadinesSudanSwedenSwitzerlandSyriaTaiwanThailandTrinidad and TobagoTurkeyUgandaUkraineUruguayUzbekistanVenezuelaVietnamWest IndiesWestern AfricaWestern AsiaWestern EuropeYemenZaireZimbabweAzores
Self-Care Disability
Income
Poverty
Unemployment
Labor Participation
Family Structure
Vehicle Availability
Education Level
Disability

Self-Care Disability Comparison

Cheyenne

Immigrants from Cameroon

Tragic
Exceptional
2.6%
SELF-CARE DISABILITY
0.6/ 100
METRIC RATING
246th/ 347
METRIC RANK
2.3%
SELF-CARE DISABILITY
99.6/ 100
METRIC RATING
58th/ 347
METRIC RANK

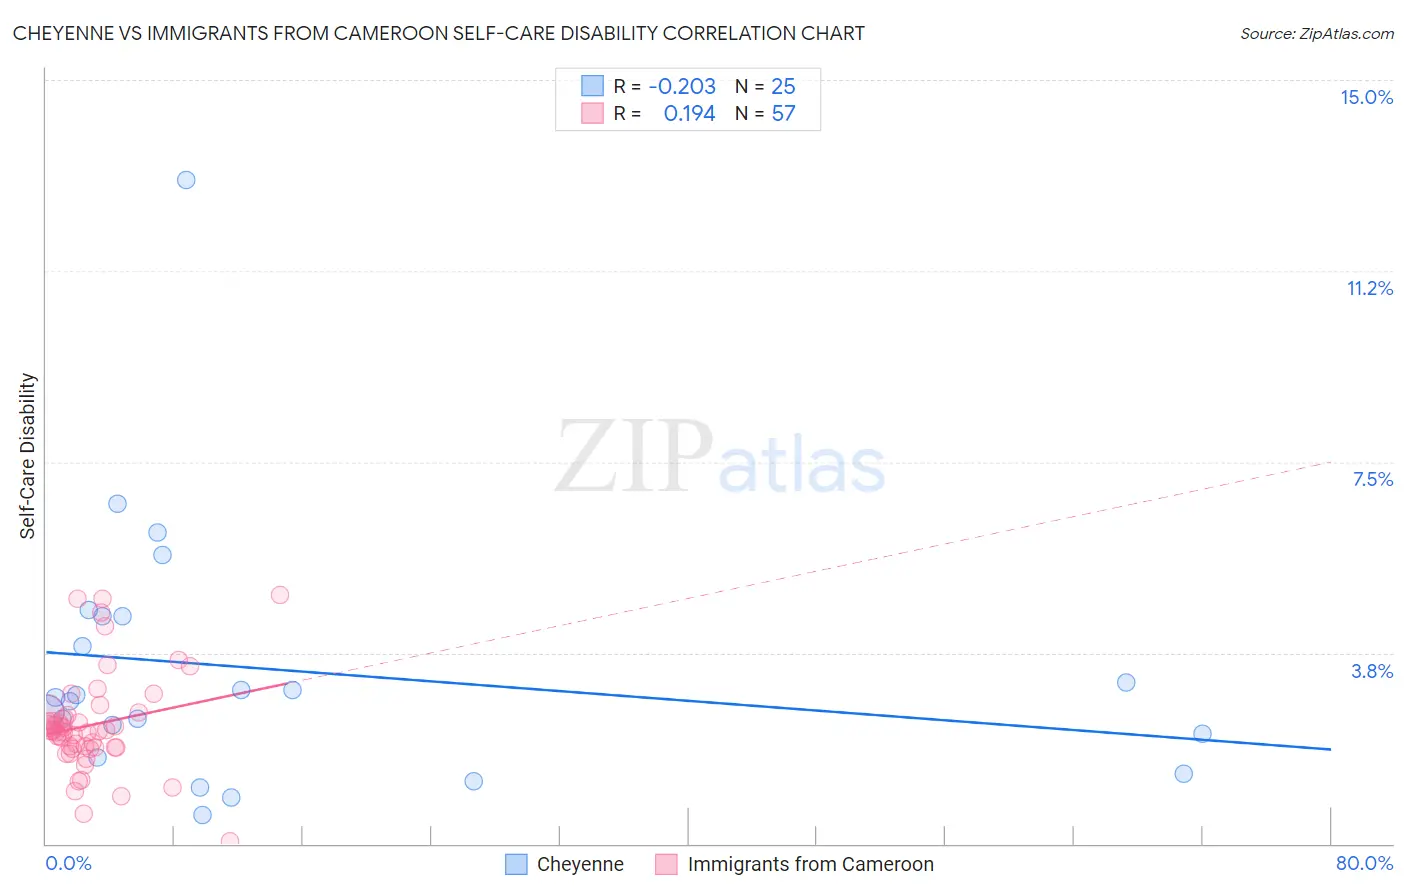
Cheyenne vs Immigrants from Cameroon Self-Care Disability Correlation Chart

The statistical analysis conducted on geographies consisting of 80,691,383 people shows a weak negative correlation between the proportion of Cheyenne and percentage of population with self-care disability in the United States with a correlation coefficient (R) of -0.203 and weighted average of 2.6%. Similarly, the statistical analysis conducted on geographies consisting of 130,698,319 people shows a poor positive correlation between the proportion of Immigrants from Cameroon and percentage of population with self-care disability in the United States with a correlation coefficient (R) of 0.194 and weighted average of 2.3%, a difference of 13.4%.
Cheyenne vs Immigrants from Cameroon Self-Care Disability

Self-Care Disability Correlation Summary

MeasurementCheyenneImmigrants from Cameroon
Minimum0.57%0.061%
Maximum13.0%4.9%
Range12.5%4.8%
Mean3.4%2.3%
Median2.9%2.2%
Interquartile 25% (IQ1)1.9%1.9%
Interquartile 75% (IQ3)4.5%2.6%
Interquartile Range (IQR)2.5%0.67%
Standard Deviation (Sample)2.6%0.97%
Standard Deviation (Population)2.5%0.96%

Similar Demographics by Self-Care Disability

Demographics Similar to Cheyenne by Self-Care Disability

In terms of self-care disability, the demographic groups most similar to Cheyenne are Immigrants from Western Asia (2.6%, a difference of 0.020%), Immigrants from Albania (2.6%, a difference of 0.13%), Nicaraguan (2.6%, a difference of 0.13%), Yuman (2.6%, a difference of 0.21%), and Hawaiian (2.6%, a difference of 0.25%).
DemographicsRating | RankSelf-Care Disability
Immigrants | Panama
1.2
/100
|
#239
Tragic
2.6%
Marshallese
1.2
/100
|
#240
Tragic
2.6%
Immigrants | Syria
1.0
/100
|
#241
Tragic
2.6%
Spanish
0.8
/100
|
#242
Tragic
2.6%
Hawaiians
0.8
/100
|
#243
Tragic
2.6%
Yuman
0.8
/100
|
#244
Tragic
2.6%
Immigrants | Western Asia
0.6
/100
|
#245
Tragic
2.6%
Cheyenne
0.6
/100
|
#246
Tragic
2.6%
Immigrants | Albania
0.6
/100
|
#247
Tragic
2.6%
Nicaraguans
0.6
/100
|
#248
Tragic
2.6%
Mexican American Indians
0.5
/100
|
#249
Tragic
2.6%
Portuguese
0.4
/100
|
#250
Tragic
2.6%
Immigrants | Liberia
0.4
/100
|
#251
Tragic
2.6%
Immigrants | Bangladesh
0.4
/100
|
#252
Tragic
2.6%
Immigrants | Haiti
0.3
/100
|
#253
Tragic
2.6%

Demographics Similar to Immigrants from Cameroon by Self-Care Disability

In terms of self-care disability, the demographic groups most similar to Immigrants from Cameroon are Immigrants from Belgium (2.3%, a difference of 0.070%), Immigrants from Eastern Asia (2.3%, a difference of 0.080%), New Zealander (2.3%, a difference of 0.11%), Immigrants from France (2.3%, a difference of 0.12%), and Argentinean (2.3%, a difference of 0.18%).
DemographicsRating | RankSelf-Care Disability
Kenyans
99.7
/100
|
#51
Exceptional
2.3%
Immigrants | Serbia
99.6
/100
|
#52
Exceptional
2.3%
Australians
99.6
/100
|
#53
Exceptional
2.3%
Argentineans
99.6
/100
|
#54
Exceptional
2.3%
Immigrants | France
99.6
/100
|
#55
Exceptional
2.3%
Immigrants | Eastern Asia
99.6
/100
|
#56
Exceptional
2.3%
Immigrants | Belgium
99.6
/100
|
#57
Exceptional
2.3%
Immigrants | Cameroon
99.6
/100
|
#58
Exceptional
2.3%
New Zealanders
99.5
/100
|
#59
Exceptional
2.3%
Immigrants | Japan
99.5
/100
|
#60
Exceptional
2.3%
Palestinians
99.4
/100
|
#61
Exceptional
2.3%
Egyptians
99.4
/100
|
#62
Exceptional
2.3%
Mongolians
99.3
/100
|
#63
Exceptional
2.3%
Swedes
99.3
/100
|
#64
Exceptional
2.3%
Brazilians
99.3
/100
|
#65
Exceptional
2.3%