Cheyenne vs Nepalese Self-Care Disability
COMPARE
Cheyenne
Nepalese
Self-Care Disability
Self-Care Disability Comparison
Cheyenne
Nepalese
2.6%
SELF-CARE DISABILITY
0.6/ 100
METRIC RATING
246th/ 347
METRIC RANK
3.0%
SELF-CARE DISABILITY
0.0/ 100
METRIC RATING
330th/ 347
METRIC RANK
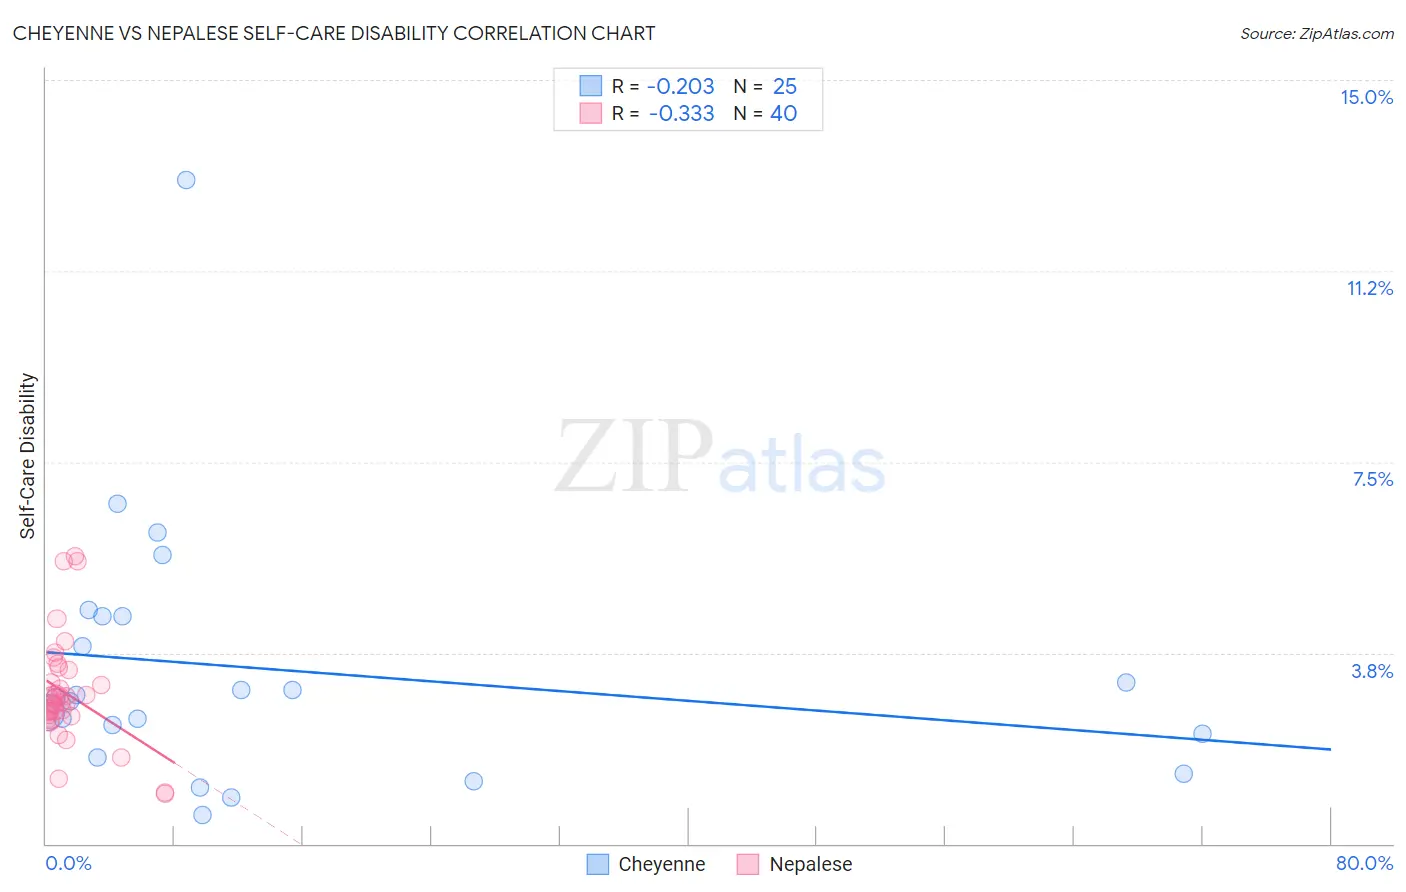
Cheyenne vs Nepalese Self-Care Disability Correlation Chart
The statistical analysis conducted on geographies consisting of 80,691,383 people shows a weak negative correlation between the proportion of Cheyenne and percentage of population with self-care disability in the United States with a correlation coefficient (R) of -0.203 and weighted average of 2.6%. Similarly, the statistical analysis conducted on geographies consisting of 24,515,553 people shows a mild negative correlation between the proportion of Nepalese and percentage of population with self-care disability in the United States with a correlation coefficient (R) of -0.333 and weighted average of 3.0%, a difference of 13.3%.
Self-Care Disability Correlation Summary
| Measurement | Cheyenne | Nepalese |
| Minimum | 0.57% | 0.99% |
| Maximum | 13.0% | 5.6% |
| Range | 12.5% | 4.7% |
| Mean | 3.4% | 3.0% |
| Median | 2.9% | 2.8% |
| Interquartile 25% (IQ1) | 1.9% | 2.5% |
| Interquartile 75% (IQ3) | 4.5% | 3.3% |
| Interquartile Range (IQR) | 2.5% | 0.76% |
| Standard Deviation (Sample) | 2.6% | 1.0% |
| Standard Deviation (Population) | 2.5% | 1.0% |
Similar Demographics by Self-Care Disability
Demographics Similar to Cheyenne by Self-Care Disability
In terms of self-care disability, the demographic groups most similar to Cheyenne are Immigrants from Western Asia (2.6%, a difference of 0.020%), Immigrants from Albania (2.6%, a difference of 0.13%), Nicaraguan (2.6%, a difference of 0.13%), Yuman (2.6%, a difference of 0.21%), and Hawaiian (2.6%, a difference of 0.25%).
| Demographics | Rating | Rank | Self-Care Disability |
| Immigrants | Panama | 1.2 /100 | #239 | Tragic 2.6% |
| Marshallese | 1.2 /100 | #240 | Tragic 2.6% |
| Immigrants | Syria | 1.0 /100 | #241 | Tragic 2.6% |
| Spanish | 0.8 /100 | #242 | Tragic 2.6% |
| Hawaiians | 0.8 /100 | #243 | Tragic 2.6% |
| Yuman | 0.8 /100 | #244 | Tragic 2.6% |
| Immigrants | Western Asia | 0.6 /100 | #245 | Tragic 2.6% |
| Cheyenne | 0.6 /100 | #246 | Tragic 2.6% |
| Immigrants | Albania | 0.6 /100 | #247 | Tragic 2.6% |
| Nicaraguans | 0.6 /100 | #248 | Tragic 2.6% |
| Mexican American Indians | 0.5 /100 | #249 | Tragic 2.6% |
| Portuguese | 0.4 /100 | #250 | Tragic 2.6% |
| Immigrants | Liberia | 0.4 /100 | #251 | Tragic 2.6% |
| Immigrants | Bangladesh | 0.4 /100 | #252 | Tragic 2.6% |
| Immigrants | Haiti | 0.3 /100 | #253 | Tragic 2.6% |
Demographics Similar to Nepalese by Self-Care Disability
In terms of self-care disability, the demographic groups most similar to Nepalese are Lumbee (3.0%, a difference of 0.12%), Kiowa (3.0%, a difference of 0.47%), Dutch West Indian (3.0%, a difference of 0.71%), Cajun (2.9%, a difference of 0.75%), and Houma (3.0%, a difference of 0.78%).
| Demographics | Rating | Rank | Self-Care Disability |
| Seminole | 0.0 /100 | #323 | Tragic 2.9% |
| Cherokee | 0.0 /100 | #324 | Tragic 2.9% |
| Immigrants | Uzbekistan | 0.0 /100 | #325 | Tragic 2.9% |
| Paiute | 0.0 /100 | #326 | Tragic 2.9% |
| Blacks/African Americans | 0.0 /100 | #327 | Tragic 2.9% |
| Hopi | 0.0 /100 | #328 | Tragic 2.9% |
| Cajuns | 0.0 /100 | #329 | Tragic 2.9% |
| Nepalese | 0.0 /100 | #330 | Tragic 3.0% |
| Lumbee | 0.0 /100 | #331 | Tragic 3.0% |
| Kiowa | 0.0 /100 | #332 | Tragic 3.0% |
| Dutch West Indians | 0.0 /100 | #333 | Tragic 3.0% |
| Houma | 0.0 /100 | #334 | Tragic 3.0% |
| Immigrants | Azores | 0.0 /100 | #335 | Tragic 3.0% |
| Immigrants | Yemen | 0.0 /100 | #336 | Tragic 3.0% |
| Choctaw | 0.0 /100 | #337 | Tragic 3.0% |