Indonesian vs Immigrants from Germany Self-Care Disability
COMPARE
Indonesian
Immigrants from Germany
Self-Care Disability
Self-Care Disability Comparison
Indonesians
Immigrants from Germany
2.5%
SELF-CARE DISABILITY
41.2/ 100
METRIC RATING
180th/ 347
METRIC RANK
2.5%
SELF-CARE DISABILITY
17.9/ 100
METRIC RATING
194th/ 347
METRIC RANK
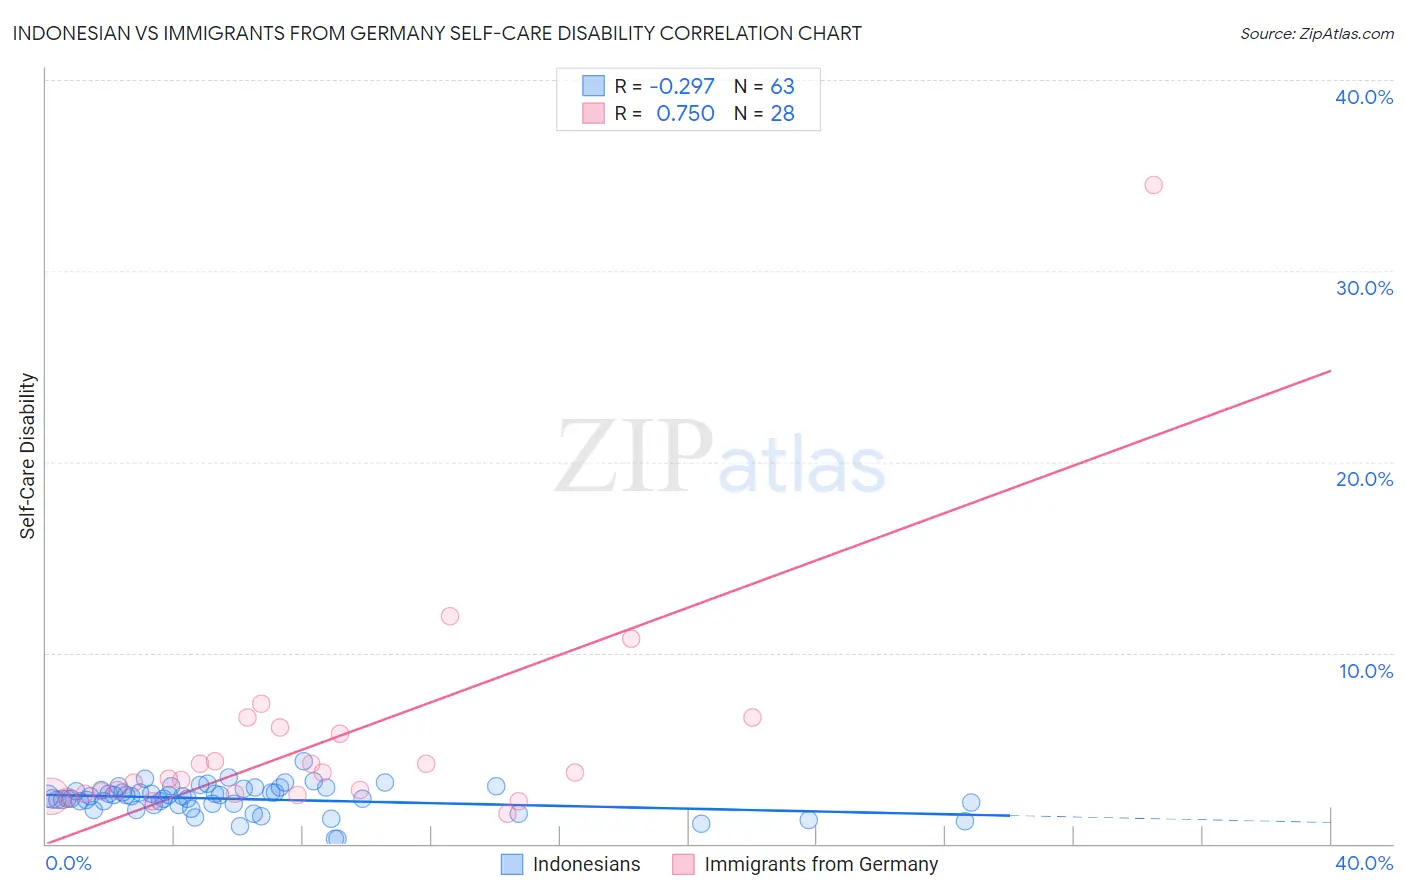
Indonesian vs Immigrants from Germany Self-Care Disability Correlation Chart
The statistical analysis conducted on geographies consisting of 162,620,981 people shows a weak negative correlation between the proportion of Indonesians and percentage of population with self-care disability in the United States with a correlation coefficient (R) of -0.297 and weighted average of 2.5%. Similarly, the statistical analysis conducted on geographies consisting of 463,338,664 people shows a strong positive correlation between the proportion of Immigrants from Germany and percentage of population with self-care disability in the United States with a correlation coefficient (R) of 0.750 and weighted average of 2.5%, a difference of 1.4%.
Self-Care Disability Correlation Summary
| Measurement | Indonesian | Immigrants from Germany |
| Minimum | 0.26% | 1.6% |
| Maximum | 4.4% | 34.5% |
| Range | 4.1% | 32.9% |
| Mean | 2.3% | 5.4% |
| Median | 2.5% | 3.6% |
| Interquartile 25% (IQ1) | 2.1% | 2.6% |
| Interquartile 75% (IQ3) | 2.8% | 5.9% |
| Interquartile Range (IQR) | 0.79% | 3.3% |
| Standard Deviation (Sample) | 0.74% | 6.2% |
| Standard Deviation (Population) | 0.74% | 6.1% |
Demographics Similar to Indonesians and Immigrants from Germany by Self-Care Disability
In terms of self-care disability, the demographic groups most similar to Indonesians are Ghanaian (2.5%, a difference of 0.040%), Maltese (2.5%, a difference of 0.19%), Hungarian (2.5%, a difference of 0.21%), English (2.5%, a difference of 0.24%), and Salvadoran (2.5%, a difference of 0.24%). Similarly, the demographic groups most similar to Immigrants from Germany are Immigrants from Southern Europe (2.5%, a difference of 0.19%), Korean (2.5%, a difference of 0.20%), Crow (2.5%, a difference of 0.23%), Ukrainian (2.5%, a difference of 0.26%), and Soviet Union (2.5%, a difference of 0.32%).
| Demographics | Rating | Rank | Self-Care Disability |
| Immigrants | Kazakhstan | 46.7 /100 | #177 | Average 2.5% |
| English | 46.2 /100 | #178 | Average 2.5% |
| Hungarians | 45.5 /100 | #179 | Average 2.5% |
| Indonesians | 41.2 /100 | #180 | Average 2.5% |
| Ghanaians | 40.4 /100 | #181 | Average 2.5% |
| Maltese | 37.5 /100 | #182 | Fair 2.5% |
| Salvadorans | 36.4 /100 | #183 | Fair 2.5% |
| Yugoslavians | 36.1 /100 | #184 | Fair 2.5% |
| Slavs | 34.3 /100 | #185 | Fair 2.5% |
| Immigrants | El Salvador | 33.0 /100 | #186 | Fair 2.5% |
| Irish | 28.7 /100 | #187 | Fair 2.5% |
| Immigrants | Oceania | 28.3 /100 | #188 | Fair 2.5% |
| Immigrants | Eastern Europe | 28.0 /100 | #189 | Fair 2.5% |
| Sioux | 24.6 /100 | #190 | Fair 2.5% |
| Moroccans | 22.9 /100 | #191 | Fair 2.5% |
| Soviet Union | 22.2 /100 | #192 | Fair 2.5% |
| Ukrainians | 21.4 /100 | #193 | Fair 2.5% |
| Immigrants | Germany | 17.9 /100 | #194 | Poor 2.5% |
| Immigrants | Southern Europe | 15.6 /100 | #195 | Poor 2.5% |
| Koreans | 15.5 /100 | #196 | Poor 2.5% |
| Crow | 15.2 /100 | #197 | Poor 2.5% |