Cheyenne vs Guatemalan Self-Care Disability
COMPARE
Cheyenne
Guatemalan
Self-Care Disability
Self-Care Disability Comparison
Cheyenne
Guatemalans
2.6%
SELF-CARE DISABILITY
0.6/ 100
METRIC RATING
246th/ 347
METRIC RANK
2.6%
SELF-CARE DISABILITY
2.7/ 100
METRIC RATING
228th/ 347
METRIC RANK
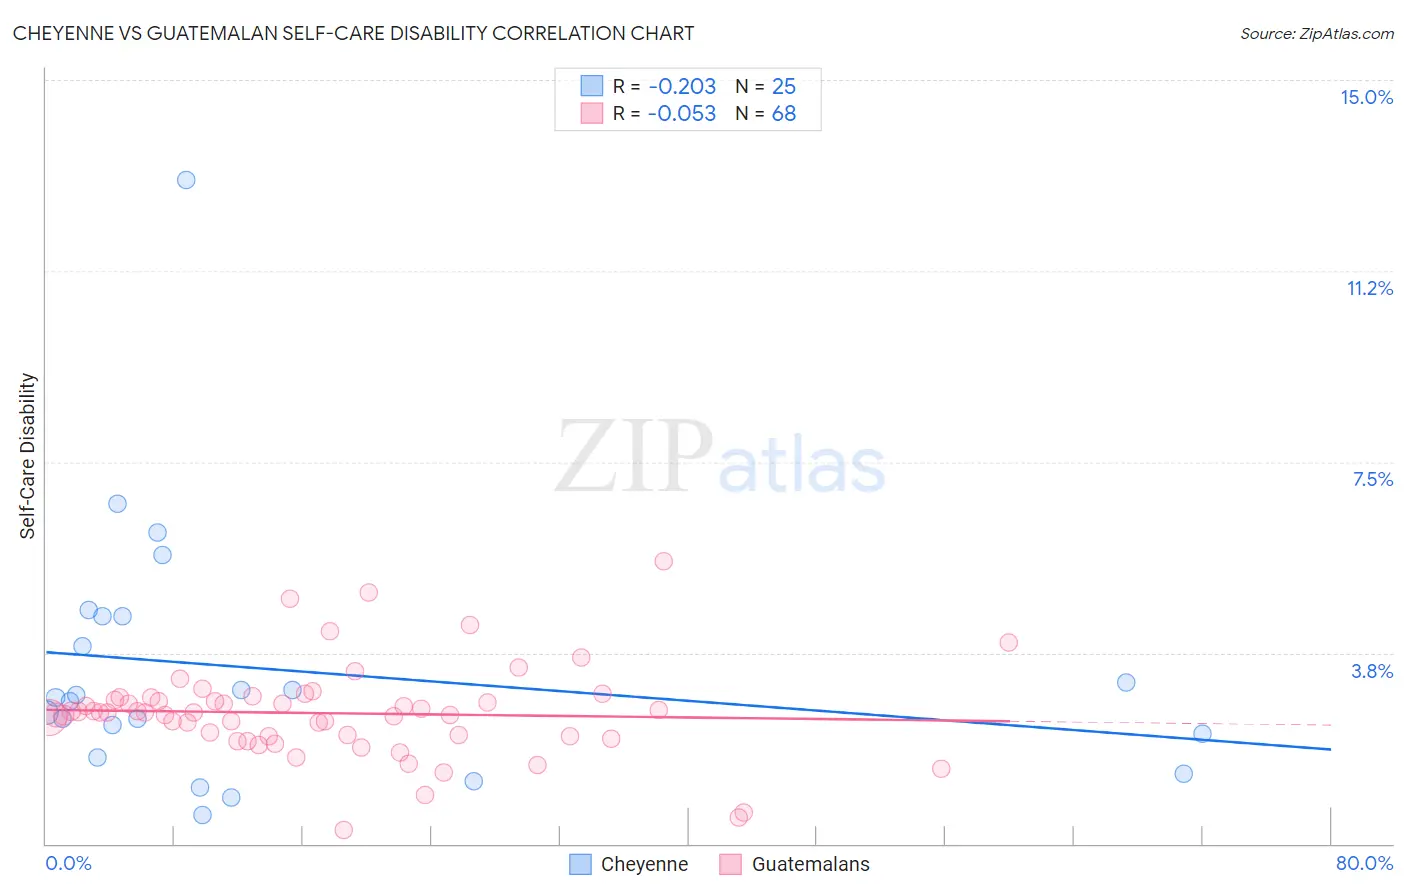
Cheyenne vs Guatemalan Self-Care Disability Correlation Chart
The statistical analysis conducted on geographies consisting of 80,691,383 people shows a weak negative correlation between the proportion of Cheyenne and percentage of population with self-care disability in the United States with a correlation coefficient (R) of -0.203 and weighted average of 2.6%. Similarly, the statistical analysis conducted on geographies consisting of 408,997,178 people shows a slight negative correlation between the proportion of Guatemalans and percentage of population with self-care disability in the United States with a correlation coefficient (R) of -0.053 and weighted average of 2.6%, a difference of 1.7%.
Self-Care Disability Correlation Summary
| Measurement | Cheyenne | Guatemalan |
| Minimum | 0.57% | 0.26% |
| Maximum | 13.0% | 5.6% |
| Range | 12.5% | 5.3% |
| Mean | 3.4% | 2.6% |
| Median | 2.9% | 2.6% |
| Interquartile 25% (IQ1) | 1.9% | 2.1% |
| Interquartile 75% (IQ3) | 4.5% | 2.8% |
| Interquartile Range (IQR) | 2.5% | 0.73% |
| Standard Deviation (Sample) | 2.6% | 0.92% |
| Standard Deviation (Population) | 2.5% | 0.91% |
Demographics Similar to Cheyenne and Guatemalans by Self-Care Disability
In terms of self-care disability, the demographic groups most similar to Cheyenne are Immigrants from Western Asia (2.6%, a difference of 0.020%), Immigrants from Albania (2.6%, a difference of 0.13%), Yuman (2.6%, a difference of 0.21%), Hawaiian (2.6%, a difference of 0.25%), and Spanish (2.6%, a difference of 0.32%). Similarly, the demographic groups most similar to Guatemalans are Immigrants from Philippines (2.6%, a difference of 0.010%), Guamanian/Chamorro (2.6%, a difference of 0.070%), Immigrants from Ecuador (2.6%, a difference of 0.080%), Immigrants from Guatemala (2.6%, a difference of 0.22%), and Albanian (2.6%, a difference of 0.25%).
| Demographics | Rating | Rank | Self-Care Disability |
| Immigrants | Philippines | 2.7 /100 | #227 | Tragic 2.6% |
| Guatemalans | 2.7 /100 | #228 | Tragic 2.6% |
| Guamanians/Chamorros | 2.5 /100 | #229 | Tragic 2.6% |
| Immigrants | Ecuador | 2.5 /100 | #230 | Tragic 2.6% |
| Immigrants | Guatemala | 2.2 /100 | #231 | Tragic 2.6% |
| Albanians | 2.2 /100 | #232 | Tragic 2.6% |
| Liberians | 2.1 /100 | #233 | Tragic 2.6% |
| Vietnamese | 2.1 /100 | #234 | Tragic 2.6% |
| Bahamians | 2.0 /100 | #235 | Tragic 2.6% |
| Bermudans | 1.9 /100 | #236 | Tragic 2.6% |
| Immigrants | Senegal | 1.6 /100 | #237 | Tragic 2.6% |
| Senegalese | 1.3 /100 | #238 | Tragic 2.6% |
| Immigrants | Panama | 1.2 /100 | #239 | Tragic 2.6% |
| Marshallese | 1.2 /100 | #240 | Tragic 2.6% |
| Immigrants | Syria | 1.0 /100 | #241 | Tragic 2.6% |
| Spanish | 0.8 /100 | #242 | Tragic 2.6% |
| Hawaiians | 0.8 /100 | #243 | Tragic 2.6% |
| Yuman | 0.8 /100 | #244 | Tragic 2.6% |
| Immigrants | Western Asia | 0.6 /100 | #245 | Tragic 2.6% |
| Cheyenne | 0.6 /100 | #246 | Tragic 2.6% |
| Immigrants | Albania | 0.6 /100 | #247 | Tragic 2.6% |