Cheyenne vs Hungarian Self-Care Disability
COMPARE
Cheyenne
Hungarian
Self-Care Disability
Self-Care Disability Comparison
Cheyenne
Hungarians
2.6%
SELF-CARE DISABILITY
0.6/ 100
METRIC RATING
246th/ 347
METRIC RANK
2.5%
SELF-CARE DISABILITY
45.5/ 100
METRIC RATING
179th/ 347
METRIC RANK
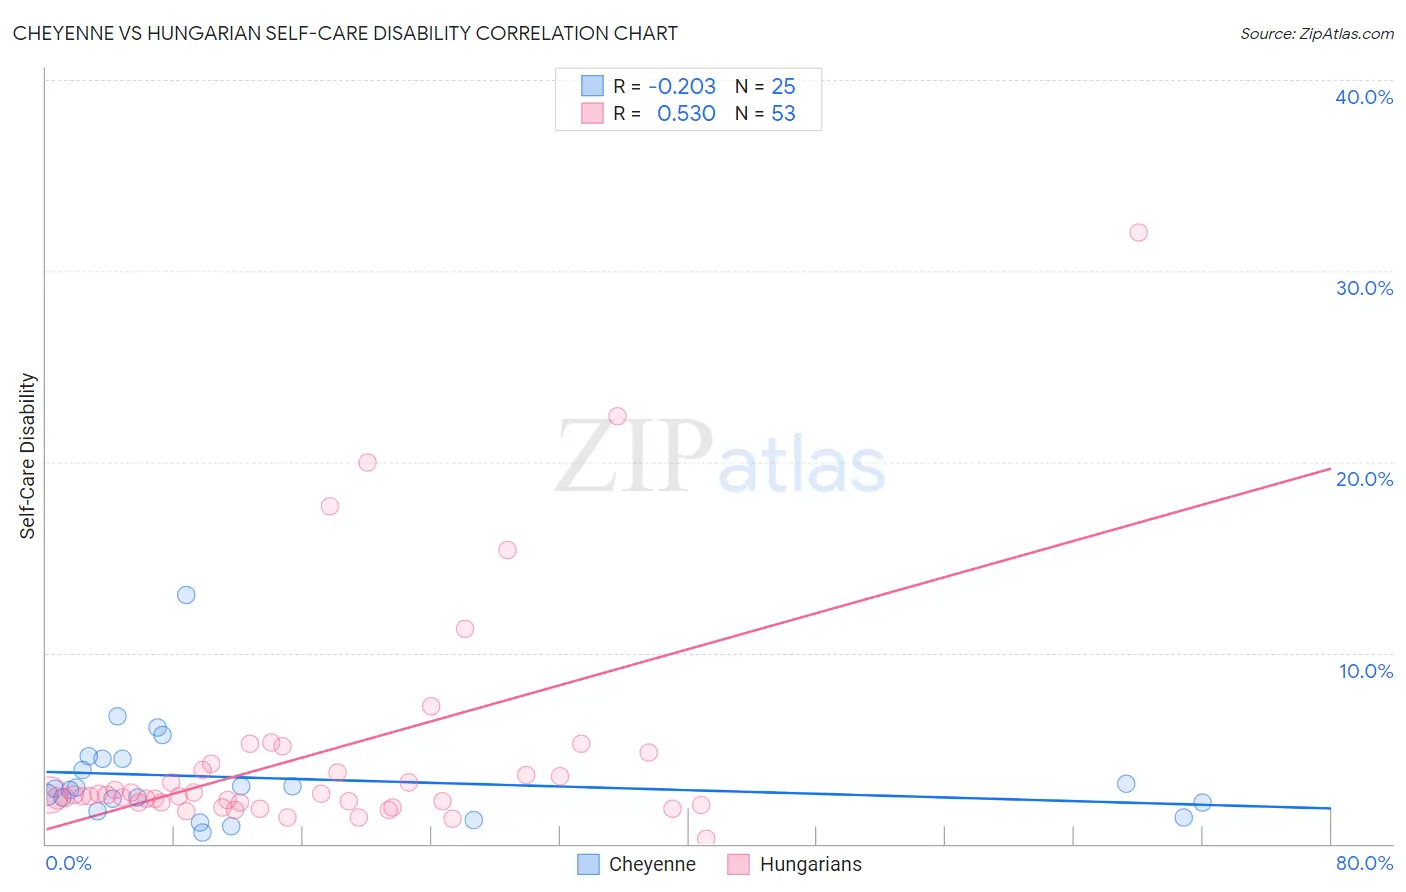
Cheyenne vs Hungarian Self-Care Disability Correlation Chart
The statistical analysis conducted on geographies consisting of 80,691,383 people shows a weak negative correlation between the proportion of Cheyenne and percentage of population with self-care disability in the United States with a correlation coefficient (R) of -0.203 and weighted average of 2.6%. Similarly, the statistical analysis conducted on geographies consisting of 485,258,327 people shows a substantial positive correlation between the proportion of Hungarians and percentage of population with self-care disability in the United States with a correlation coefficient (R) of 0.530 and weighted average of 2.5%, a difference of 5.8%.
Self-Care Disability Correlation Summary
| Measurement | Cheyenne | Hungarian |
| Minimum | 0.57% | 0.28% |
| Maximum | 13.0% | 32.0% |
| Range | 12.5% | 31.7% |
| Mean | 3.4% | 4.7% |
| Median | 2.9% | 2.5% |
| Interquartile 25% (IQ1) | 1.9% | 2.2% |
| Interquartile 75% (IQ3) | 4.5% | 4.0% |
| Interquartile Range (IQR) | 2.5% | 1.8% |
| Standard Deviation (Sample) | 2.6% | 6.0% |
| Standard Deviation (Population) | 2.5% | 5.9% |
Similar Demographics by Self-Care Disability
Demographics Similar to Cheyenne by Self-Care Disability
In terms of self-care disability, the demographic groups most similar to Cheyenne are Immigrants from Western Asia (2.6%, a difference of 0.020%), Immigrants from Albania (2.6%, a difference of 0.13%), Nicaraguan (2.6%, a difference of 0.13%), Yuman (2.6%, a difference of 0.21%), and Hawaiian (2.6%, a difference of 0.25%).
| Demographics | Rating | Rank | Self-Care Disability |
| Immigrants | Panama | 1.2 /100 | #239 | Tragic 2.6% |
| Marshallese | 1.2 /100 | #240 | Tragic 2.6% |
| Immigrants | Syria | 1.0 /100 | #241 | Tragic 2.6% |
| Spanish | 0.8 /100 | #242 | Tragic 2.6% |
| Hawaiians | 0.8 /100 | #243 | Tragic 2.6% |
| Yuman | 0.8 /100 | #244 | Tragic 2.6% |
| Immigrants | Western Asia | 0.6 /100 | #245 | Tragic 2.6% |
| Cheyenne | 0.6 /100 | #246 | Tragic 2.6% |
| Immigrants | Albania | 0.6 /100 | #247 | Tragic 2.6% |
| Nicaraguans | 0.6 /100 | #248 | Tragic 2.6% |
| Mexican American Indians | 0.5 /100 | #249 | Tragic 2.6% |
| Portuguese | 0.4 /100 | #250 | Tragic 2.6% |
| Immigrants | Liberia | 0.4 /100 | #251 | Tragic 2.6% |
| Immigrants | Bangladesh | 0.4 /100 | #252 | Tragic 2.6% |
| Immigrants | Haiti | 0.3 /100 | #253 | Tragic 2.6% |
Demographics Similar to Hungarians by Self-Care Disability
In terms of self-care disability, the demographic groups most similar to Hungarians are English (2.5%, a difference of 0.030%), Immigrants from Kazakhstan (2.5%, a difference of 0.060%), Immigrants from Afghanistan (2.5%, a difference of 0.10%), Immigrants from Bosnia and Herzegovina (2.5%, a difference of 0.20%), and Indonesian (2.5%, a difference of 0.21%).
| Demographics | Rating | Rank | Self-Care Disability |
| Czechoslovakians | 53.5 /100 | #172 | Average 2.5% |
| Immigrants | Burma/Myanmar | 52.8 /100 | #173 | Average 2.5% |
| Welsh | 50.0 /100 | #174 | Average 2.5% |
| Immigrants | Bosnia and Herzegovina | 49.6 /100 | #175 | Average 2.5% |
| Immigrants | Afghanistan | 47.6 /100 | #176 | Average 2.5% |
| Immigrants | Kazakhstan | 46.7 /100 | #177 | Average 2.5% |
| English | 46.2 /100 | #178 | Average 2.5% |
| Hungarians | 45.5 /100 | #179 | Average 2.5% |
| Indonesians | 41.2 /100 | #180 | Average 2.5% |
| Ghanaians | 40.4 /100 | #181 | Average 2.5% |
| Maltese | 37.5 /100 | #182 | Fair 2.5% |
| Salvadorans | 36.4 /100 | #183 | Fair 2.5% |
| Yugoslavians | 36.1 /100 | #184 | Fair 2.5% |
| Slavs | 34.3 /100 | #185 | Fair 2.5% |
| Immigrants | El Salvador | 33.0 /100 | #186 | Fair 2.5% |