Alaska Native vs Immigrants from Germany Self-Care Disability
COMPARE
Alaska Native
Immigrants from Germany
Self-Care Disability
Self-Care Disability Comparison
Alaska Natives
Immigrants from Germany
2.4%
SELF-CARE DISABILITY
84.5/ 100
METRIC RATING
141st/ 347
METRIC RANK
2.5%
SELF-CARE DISABILITY
17.9/ 100
METRIC RATING
194th/ 347
METRIC RANK
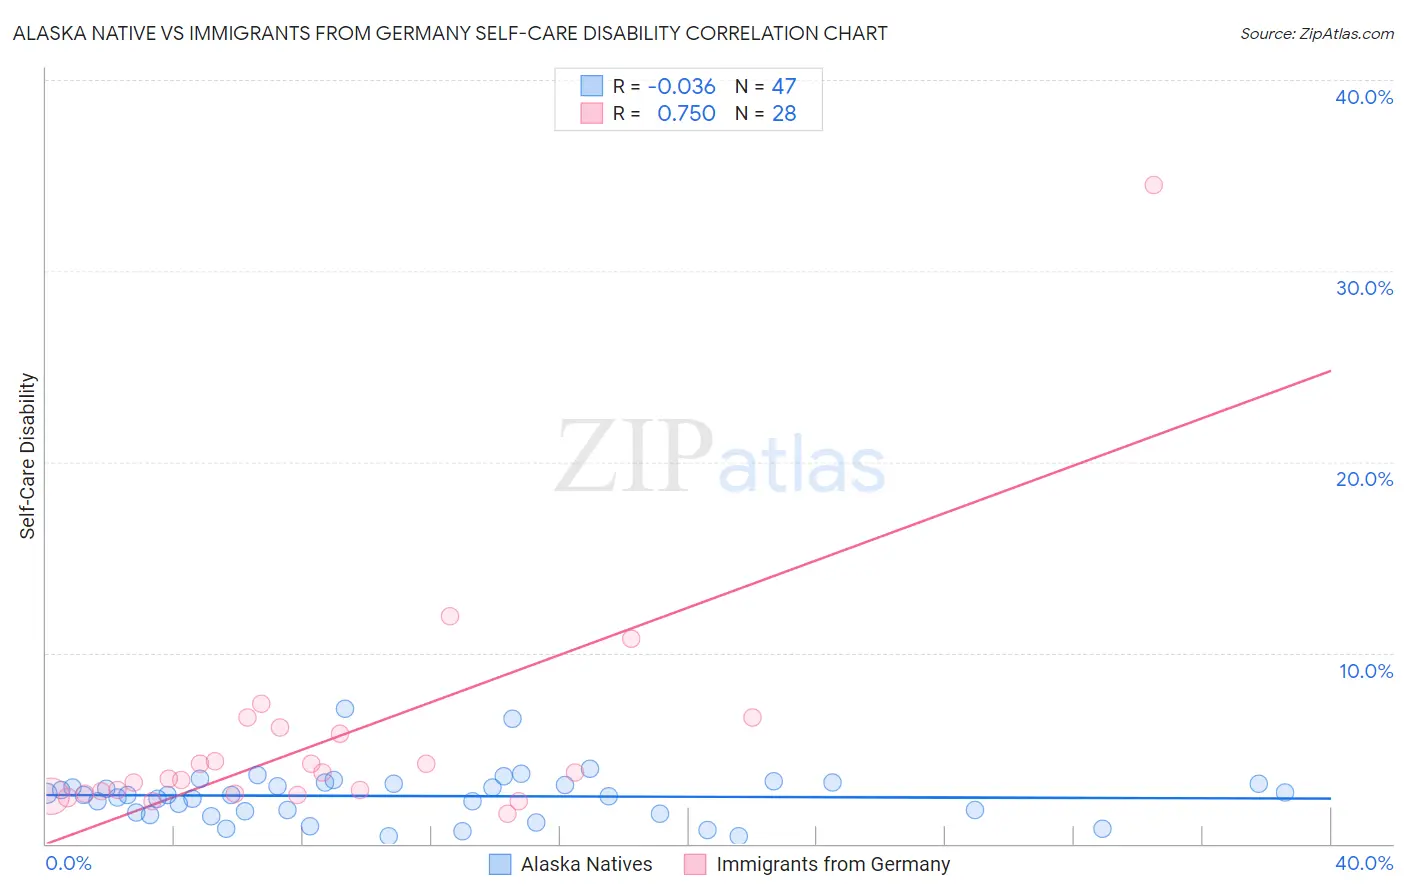
Alaska Native vs Immigrants from Germany Self-Care Disability Correlation Chart
The statistical analysis conducted on geographies consisting of 76,706,144 people shows no correlation between the proportion of Alaska Natives and percentage of population with self-care disability in the United States with a correlation coefficient (R) of -0.036 and weighted average of 2.4%. Similarly, the statistical analysis conducted on geographies consisting of 463,338,664 people shows a strong positive correlation between the proportion of Immigrants from Germany and percentage of population with self-care disability in the United States with a correlation coefficient (R) of 0.750 and weighted average of 2.5%, a difference of 3.9%.
Self-Care Disability Correlation Summary
| Measurement | Alaska Native | Immigrants from Germany |
| Minimum | 0.38% | 1.6% |
| Maximum | 7.1% | 34.5% |
| Range | 6.7% | 32.9% |
| Mean | 2.5% | 5.4% |
| Median | 2.5% | 3.6% |
| Interquartile 25% (IQ1) | 1.7% | 2.6% |
| Interquartile 75% (IQ3) | 3.2% | 5.9% |
| Interquartile Range (IQR) | 1.5% | 3.3% |
| Standard Deviation (Sample) | 1.3% | 6.2% |
| Standard Deviation (Population) | 1.3% | 6.1% |
Similar Demographics by Self-Care Disability
Demographics Similar to Alaska Natives by Self-Care Disability
In terms of self-care disability, the demographic groups most similar to Alaska Natives are Immigrants from Uruguay (2.4%, a difference of 0.090%), Immigrants from Peru (2.4%, a difference of 0.12%), Afghan (2.4%, a difference of 0.19%), Immigrants from Croatia (2.4%, a difference of 0.21%), and Sri Lankan (2.4%, a difference of 0.21%).
| Demographics | Rating | Rank | Self-Care Disability |
| Russians | 88.2 /100 | #134 | Excellent 2.4% |
| Laotians | 87.8 /100 | #135 | Excellent 2.4% |
| South American Indians | 87.2 /100 | #136 | Excellent 2.4% |
| Austrians | 87.0 /100 | #137 | Excellent 2.4% |
| Immigrants | Croatia | 86.6 /100 | #138 | Excellent 2.4% |
| Sri Lankans | 86.6 /100 | #139 | Excellent 2.4% |
| Immigrants | Uruguay | 85.4 /100 | #140 | Excellent 2.4% |
| Alaska Natives | 84.5 /100 | #141 | Excellent 2.4% |
| Immigrants | Peru | 83.2 /100 | #142 | Excellent 2.4% |
| Afghans | 82.3 /100 | #143 | Excellent 2.4% |
| Costa Ricans | 80.8 /100 | #144 | Excellent 2.4% |
| Germans | 80.1 /100 | #145 | Excellent 2.4% |
| Israelis | 80.0 /100 | #146 | Good 2.4% |
| Dutch | 77.5 /100 | #147 | Good 2.4% |
| Romanians | 75.8 /100 | #148 | Good 2.4% |
Demographics Similar to Immigrants from Germany by Self-Care Disability
In terms of self-care disability, the demographic groups most similar to Immigrants from Germany are Immigrants from Southern Europe (2.5%, a difference of 0.19%), Korean (2.5%, a difference of 0.20%), Crow (2.5%, a difference of 0.23%), Immigrants (2.5%, a difference of 0.25%), and Ukrainian (2.5%, a difference of 0.26%).
| Demographics | Rating | Rank | Self-Care Disability |
| Irish | 28.7 /100 | #187 | Fair 2.5% |
| Immigrants | Oceania | 28.3 /100 | #188 | Fair 2.5% |
| Immigrants | Eastern Europe | 28.0 /100 | #189 | Fair 2.5% |
| Sioux | 24.6 /100 | #190 | Fair 2.5% |
| Moroccans | 22.9 /100 | #191 | Fair 2.5% |
| Soviet Union | 22.2 /100 | #192 | Fair 2.5% |
| Ukrainians | 21.4 /100 | #193 | Fair 2.5% |
| Immigrants | Germany | 17.9 /100 | #194 | Poor 2.5% |
| Immigrants | Southern Europe | 15.6 /100 | #195 | Poor 2.5% |
| Koreans | 15.5 /100 | #196 | Poor 2.5% |
| Crow | 15.2 /100 | #197 | Poor 2.5% |
| Immigrants | Immigrants | 15.0 /100 | #198 | Poor 2.5% |
| Immigrants | Ghana | 14.7 /100 | #199 | Poor 2.5% |
| Immigrants | Western Africa | 13.3 /100 | #200 | Poor 2.5% |
| Immigrants | South Eastern Asia | 12.9 /100 | #201 | Poor 2.5% |