Dutch vs Greek Disability Age Under 5
COMPARE
Dutch
Greek
Disability Age Under 5
Disability Age Under 5 Comparison
Dutch
Greeks
1.7%
DISABILITY AGE UNDER 5
0.0/ 100
METRIC RATING
315th/ 347
METRIC RANK
1.5%
DISABILITY AGE UNDER 5
0.0/ 100
METRIC RATING
276th/ 347
METRIC RANK
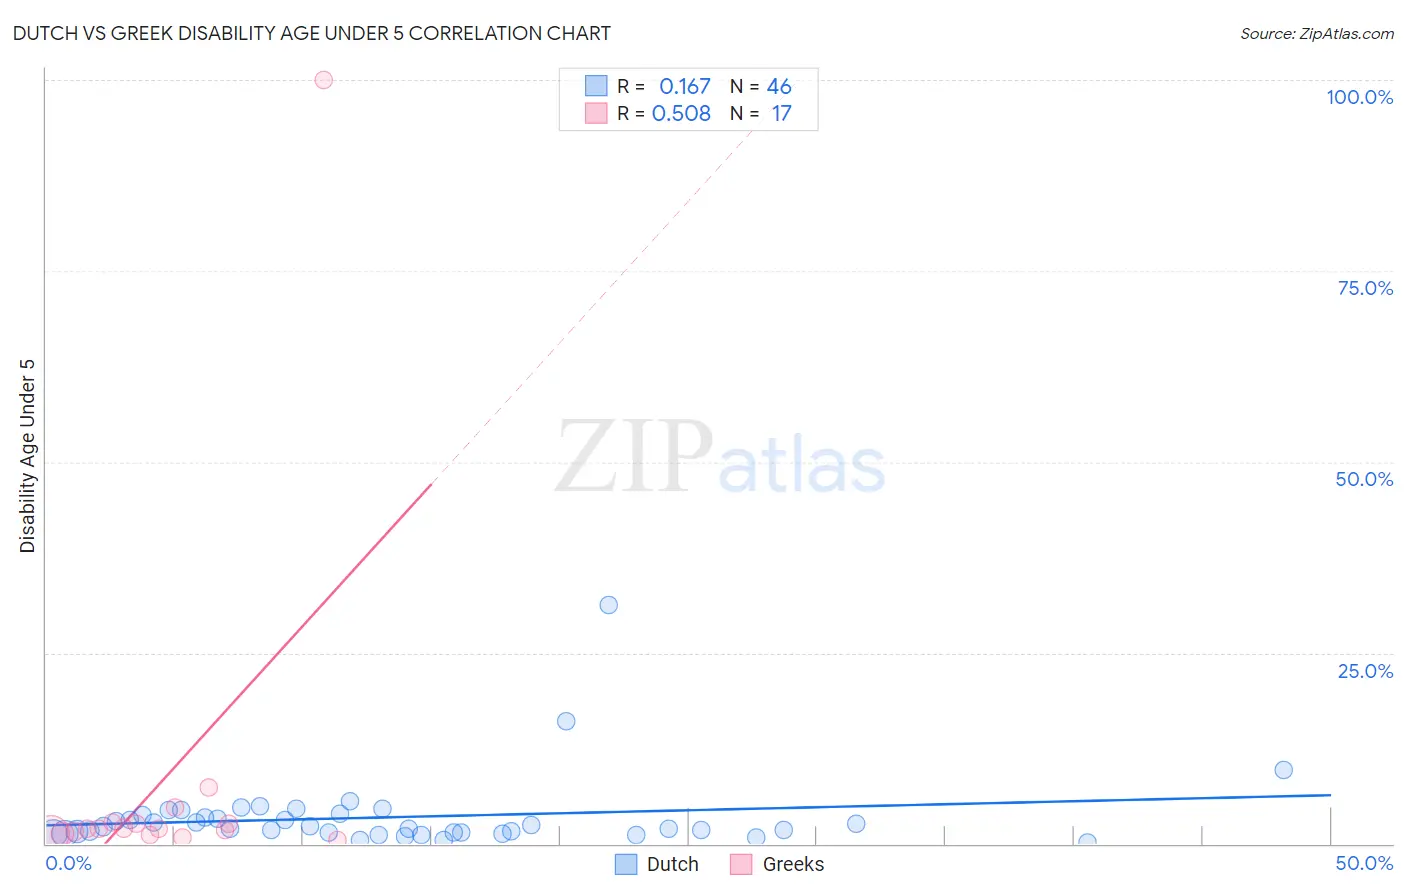
Dutch vs Greek Disability Age Under 5 Correlation Chart
The statistical analysis conducted on geographies consisting of 256,007,977 people shows a poor positive correlation between the proportion of Dutch and percentage of population with a disability under the age of 5 in the United States with a correlation coefficient (R) of 0.167 and weighted average of 1.7%. Similarly, the statistical analysis conducted on geographies consisting of 239,993,794 people shows a substantial positive correlation between the proportion of Greeks and percentage of population with a disability under the age of 5 in the United States with a correlation coefficient (R) of 0.508 and weighted average of 1.5%, a difference of 14.8%.
Disability Age Under 5 Correlation Summary
| Measurement | Dutch | Greek |
| Minimum | 0.18% | 0.57% |
| Maximum | 31.2% | 100.0% |
| Range | 31.1% | 99.4% |
| Mean | 3.5% | 8.0% |
| Median | 2.1% | 2.0% |
| Interquartile 25% (IQ1) | 1.5% | 1.3% |
| Interquartile 75% (IQ3) | 3.8% | 2.7% |
| Interquartile Range (IQR) | 2.4% | 1.4% |
| Standard Deviation (Sample) | 4.9% | 23.8% |
| Standard Deviation (Population) | 4.9% | 23.0% |
Similar Demographics by Disability Age Under 5
Demographics Similar to Dutch by Disability Age Under 5
In terms of disability age under 5, the demographic groups most similar to Dutch are Immigrants from Cabo Verde (1.7%, a difference of 0.18%), Norwegian (1.7%, a difference of 0.26%), Celtic (1.7%, a difference of 0.42%), Puerto Rican (1.7%, a difference of 0.58%), and French (1.7%, a difference of 0.61%).
| Demographics | Rating | Rank | Disability Age Under 5 |
| Navajo | 0.0 /100 | #308 | Tragic 1.6% |
| Cape Verdeans | 0.0 /100 | #309 | Tragic 1.7% |
| Whites/Caucasians | 0.0 /100 | #310 | Tragic 1.7% |
| English | 0.0 /100 | #311 | Tragic 1.7% |
| Puerto Ricans | 0.0 /100 | #312 | Tragic 1.7% |
| Celtics | 0.0 /100 | #313 | Tragic 1.7% |
| Norwegians | 0.0 /100 | #314 | Tragic 1.7% |
| Dutch | 0.0 /100 | #315 | Tragic 1.7% |
| Immigrants | Cabo Verde | 0.0 /100 | #316 | Tragic 1.7% |
| French | 0.0 /100 | #317 | Tragic 1.7% |
| Irish | 0.0 /100 | #318 | Tragic 1.7% |
| Slovaks | 0.0 /100 | #319 | Tragic 1.7% |
| Scotch-Irish | 0.0 /100 | #320 | Tragic 1.7% |
| Ottawa | 0.0 /100 | #321 | Tragic 1.7% |
| Germans | 0.0 /100 | #322 | Tragic 1.7% |
Demographics Similar to Greeks by Disability Age Under 5
In terms of disability age under 5, the demographic groups most similar to Greeks are Brazilian (1.5%, a difference of 0.57%), Iroquois (1.5%, a difference of 0.69%), Canadian (1.5%, a difference of 0.70%), Kiowa (1.5%, a difference of 0.78%), and Danish (1.5%, a difference of 0.79%).
| Demographics | Rating | Rank | Disability Age Under 5 |
| Austrians | 0.1 /100 | #269 | Tragic 1.4% |
| Immigrants | North America | 0.1 /100 | #270 | Tragic 1.4% |
| Immigrants | Canada | 0.1 /100 | #271 | Tragic 1.4% |
| Blacks/African Americans | 0.1 /100 | #272 | Tragic 1.4% |
| Alaskan Athabascans | 0.1 /100 | #273 | Tragic 1.5% |
| Iroquois | 0.0 /100 | #274 | Tragic 1.5% |
| Brazilians | 0.0 /100 | #275 | Tragic 1.5% |
| Greeks | 0.0 /100 | #276 | Tragic 1.5% |
| Canadians | 0.0 /100 | #277 | Tragic 1.5% |
| Kiowa | 0.0 /100 | #278 | Tragic 1.5% |
| Danes | 0.0 /100 | #279 | Tragic 1.5% |
| British | 0.0 /100 | #280 | Tragic 1.5% |
| Czechoslovakians | 0.0 /100 | #281 | Tragic 1.5% |
| Cheyenne | 0.0 /100 | #282 | Tragic 1.5% |
| Delaware | 0.0 /100 | #283 | Tragic 1.5% |