Cheyenne vs Greek Cognitive Disability
COMPARE
Cheyenne
Greek
Cognitive Disability
Cognitive Disability Comparison
Cheyenne
Greeks
17.8%
COGNITIVE DISABILITY
1.7/ 100
METRIC RATING
238th/ 347
METRIC RANK
16.4%
COGNITIVE DISABILITY
99.9/ 100
METRIC RATING
36th/ 347
METRIC RANK
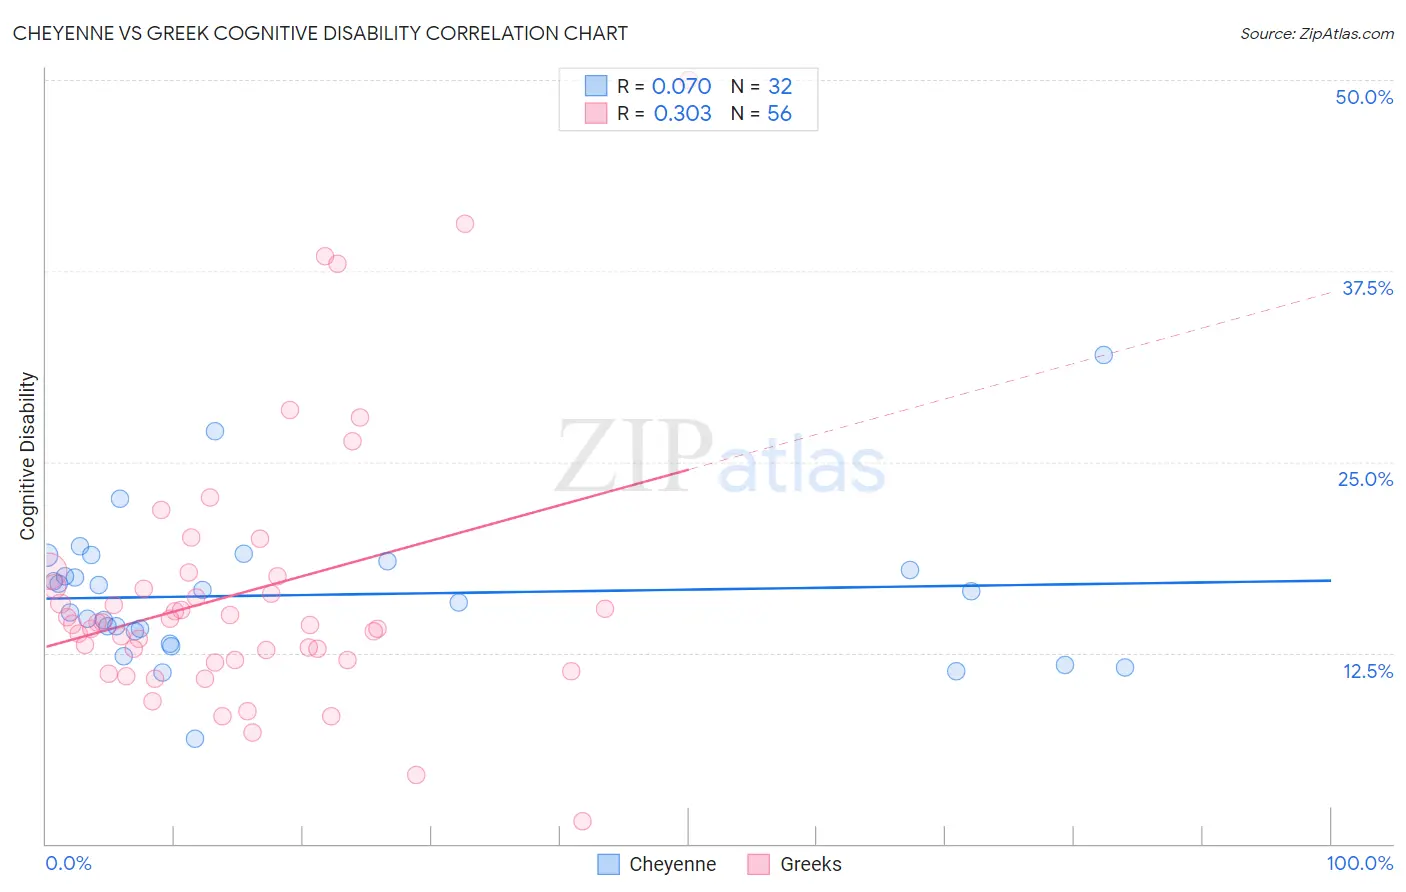
Cheyenne vs Greek Cognitive Disability Correlation Chart
The statistical analysis conducted on geographies consisting of 80,710,475 people shows a slight positive correlation between the proportion of Cheyenne and percentage of population with cognitive disability in the United States with a correlation coefficient (R) of 0.070 and weighted average of 17.8%. Similarly, the statistical analysis conducted on geographies consisting of 482,712,046 people shows a mild positive correlation between the proportion of Greeks and percentage of population with cognitive disability in the United States with a correlation coefficient (R) of 0.303 and weighted average of 16.4%, a difference of 8.2%.
Cognitive Disability Correlation Summary
| Measurement | Cheyenne | Greek |
| Minimum | 6.9% | 1.5% |
| Maximum | 32.0% | 50.0% |
| Range | 25.1% | 48.5% |
| Mean | 16.3% | 16.4% |
| Median | 16.2% | 14.4% |
| Interquartile 25% (IQ1) | 13.5% | 12.0% |
| Interquartile 75% (IQ3) | 18.2% | 17.2% |
| Interquartile Range (IQR) | 4.7% | 5.2% |
| Standard Deviation (Sample) | 4.7% | 8.7% |
| Standard Deviation (Population) | 4.6% | 8.6% |
Similar Demographics by Cognitive Disability
Demographics Similar to Cheyenne by Cognitive Disability
In terms of cognitive disability, the demographic groups most similar to Cheyenne are Immigrants from Iraq (17.8%, a difference of 0.040%), Immigrants from Mexico (17.8%, a difference of 0.040%), Osage (17.8%, a difference of 0.10%), Spanish American Indian (17.8%, a difference of 0.10%), and Panamanian (17.8%, a difference of 0.12%).
| Demographics | Rating | Rank | Cognitive Disability |
| Guatemalans | 2.1 /100 | #231 | Tragic 17.8% |
| Tongans | 2.1 /100 | #232 | Tragic 17.8% |
| Panamanians | 2.1 /100 | #233 | Tragic 17.8% |
| Osage | 2.0 /100 | #234 | Tragic 17.8% |
| Spanish American Indians | 2.0 /100 | #235 | Tragic 17.8% |
| Immigrants | Iraq | 1.8 /100 | #236 | Tragic 17.8% |
| Immigrants | Mexico | 1.8 /100 | #237 | Tragic 17.8% |
| Cheyenne | 1.7 /100 | #238 | Tragic 17.8% |
| Cajuns | 1.4 /100 | #239 | Tragic 17.8% |
| Iraqis | 1.4 /100 | #240 | Tragic 17.8% |
| Mexicans | 1.1 /100 | #241 | Tragic 17.8% |
| Paiute | 1.1 /100 | #242 | Tragic 17.8% |
| Immigrants | Bangladesh | 1.0 /100 | #243 | Tragic 17.8% |
| Jamaicans | 0.9 /100 | #244 | Tragic 17.9% |
| Trinidadians and Tobagonians | 0.8 /100 | #245 | Tragic 17.9% |
Demographics Similar to Greeks by Cognitive Disability
In terms of cognitive disability, the demographic groups most similar to Greeks are Slovak (16.4%, a difference of 0.010%), Italian (16.4%, a difference of 0.090%), Russian (16.4%, a difference of 0.090%), Slovene (16.5%, a difference of 0.15%), and Immigrants from Israel (16.4%, a difference of 0.16%).
| Demographics | Rating | Rank | Cognitive Disability |
| Filipinos | 99.9 /100 | #29 | Exceptional 16.4% |
| Czechs | 99.9 /100 | #30 | Exceptional 16.4% |
| Immigrants | Romania | 99.9 /100 | #31 | Exceptional 16.4% |
| Immigrants | Israel | 99.9 /100 | #32 | Exceptional 16.4% |
| Italians | 99.9 /100 | #33 | Exceptional 16.4% |
| Russians | 99.9 /100 | #34 | Exceptional 16.4% |
| Slovaks | 99.9 /100 | #35 | Exceptional 16.4% |
| Greeks | 99.9 /100 | #36 | Exceptional 16.4% |
| Slovenes | 99.9 /100 | #37 | Exceptional 16.5% |
| Immigrants | Eastern Europe | 99.9 /100 | #38 | Exceptional 16.5% |
| Bolivians | 99.9 /100 | #39 | Exceptional 16.5% |
| Immigrants | Belarus | 99.9 /100 | #40 | Exceptional 16.5% |
| Cubans | 99.9 /100 | #41 | Exceptional 16.5% |
| Hungarians | 99.9 /100 | #42 | Exceptional 16.5% |
| Immigrants | Canada | 99.8 /100 | #43 | Exceptional 16.5% |