Chippewa vs Greek Disability Age Under 5
COMPARE
Chippewa
Greek
Disability Age Under 5
Disability Age Under 5 Comparison
Chippewa
Greeks
1.9%
DISABILITY AGE UNDER 5
0.0/ 100
METRIC RATING
332nd/ 347
METRIC RANK
1.5%
DISABILITY AGE UNDER 5
0.0/ 100
METRIC RATING
276th/ 347
METRIC RANK
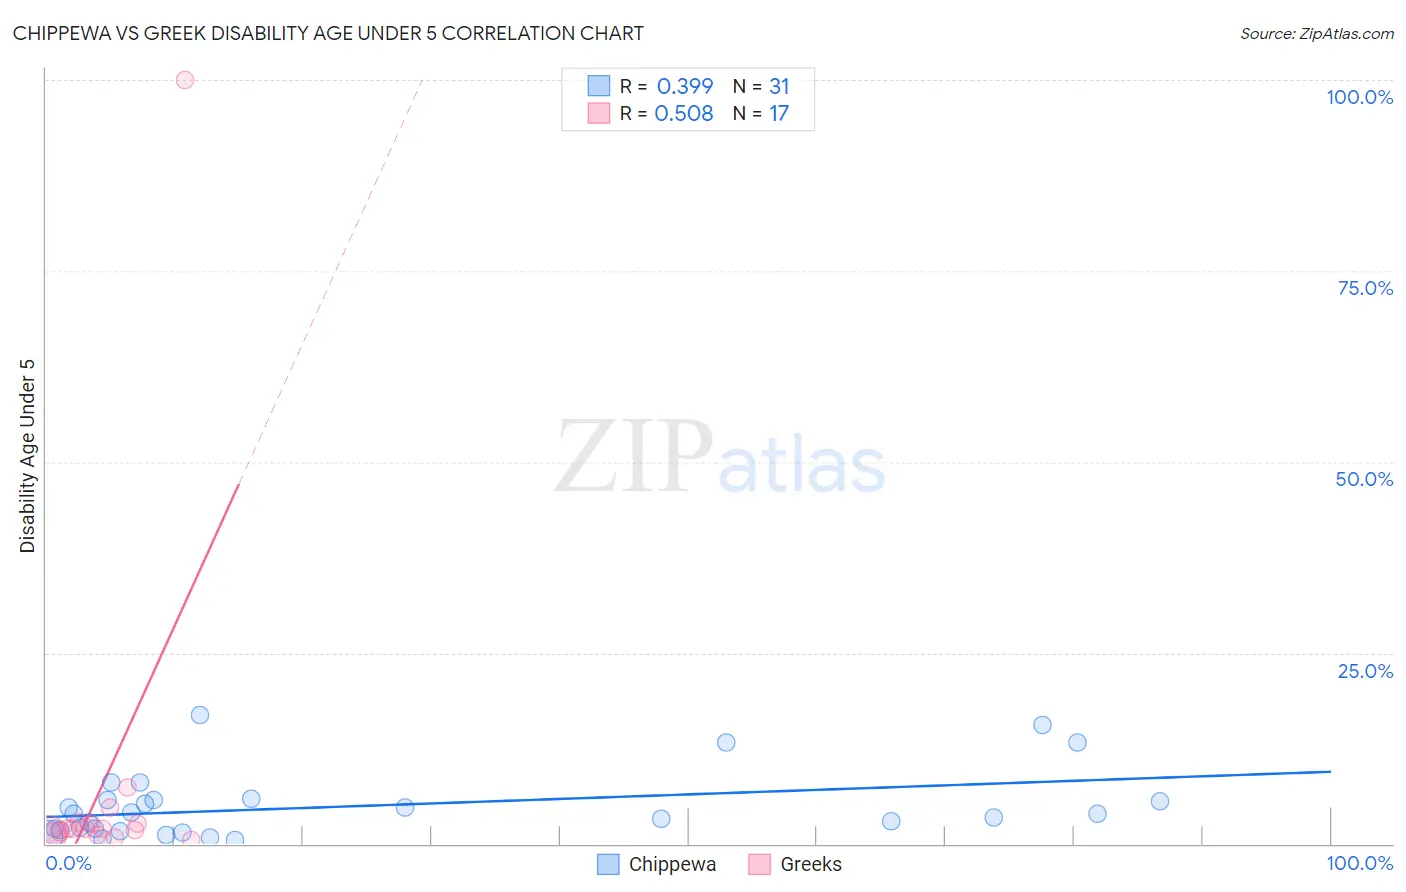
Chippewa vs Greek Disability Age Under 5 Correlation Chart
The statistical analysis conducted on geographies consisting of 140,016,256 people shows a mild positive correlation between the proportion of Chippewa and percentage of population with a disability under the age of 5 in the United States with a correlation coefficient (R) of 0.399 and weighted average of 1.9%. Similarly, the statistical analysis conducted on geographies consisting of 239,993,794 people shows a substantial positive correlation between the proportion of Greeks and percentage of population with a disability under the age of 5 in the United States with a correlation coefficient (R) of 0.508 and weighted average of 1.5%, a difference of 28.4%.
Disability Age Under 5 Correlation Summary
| Measurement | Chippewa | Greek |
| Minimum | 0.43% | 0.57% |
| Maximum | 16.9% | 100.0% |
| Range | 16.5% | 99.4% |
| Mean | 4.9% | 8.0% |
| Median | 3.9% | 2.0% |
| Interquartile 25% (IQ1) | 1.8% | 1.3% |
| Interquartile 75% (IQ3) | 5.8% | 2.7% |
| Interquartile Range (IQR) | 4.0% | 1.4% |
| Standard Deviation (Sample) | 4.4% | 23.8% |
| Standard Deviation (Population) | 4.3% | 23.0% |
Similar Demographics by Disability Age Under 5
Demographics Similar to Chippewa by Disability Age Under 5
In terms of disability age under 5, the demographic groups most similar to Chippewa are French Canadian (1.9%, a difference of 0.060%), Choctaw (1.9%, a difference of 0.36%), Houma (1.9%, a difference of 0.69%), American (1.9%, a difference of 1.2%), and Osage (1.8%, a difference of 2.9%).
| Demographics | Rating | Rank | Disability Age Under 5 |
| Immigrants | Portugal | 0.0 /100 | #325 | Tragic 1.8% |
| Sioux | 0.0 /100 | #326 | Tragic 1.8% |
| Osage | 0.0 /100 | #327 | Tragic 1.8% |
| Americans | 0.0 /100 | #328 | Tragic 1.9% |
| Houma | 0.0 /100 | #329 | Tragic 1.9% |
| Choctaw | 0.0 /100 | #330 | Tragic 1.9% |
| French Canadians | 0.0 /100 | #331 | Tragic 1.9% |
| Chippewa | 0.0 /100 | #332 | Tragic 1.9% |
| Dutch West Indians | 0.0 /100 | #333 | Tragic 1.9% |
| Natives/Alaskans | 0.0 /100 | #334 | Tragic 1.9% |
| Pennsylvania Germans | 0.0 /100 | #335 | Tragic 1.9% |
| Paraguayans | 0.0 /100 | #336 | Tragic 2.0% |
| Apache | 0.0 /100 | #337 | Tragic 2.0% |
| Tohono O'odham | 0.0 /100 | #338 | Tragic 2.2% |
| Immigrants | Azores | 0.0 /100 | #339 | Tragic 2.2% |
Demographics Similar to Greeks by Disability Age Under 5
In terms of disability age under 5, the demographic groups most similar to Greeks are Brazilian (1.5%, a difference of 0.57%), Iroquois (1.5%, a difference of 0.69%), Canadian (1.5%, a difference of 0.70%), Kiowa (1.5%, a difference of 0.78%), and Danish (1.5%, a difference of 0.79%).
| Demographics | Rating | Rank | Disability Age Under 5 |
| Austrians | 0.1 /100 | #269 | Tragic 1.4% |
| Immigrants | North America | 0.1 /100 | #270 | Tragic 1.4% |
| Immigrants | Canada | 0.1 /100 | #271 | Tragic 1.4% |
| Blacks/African Americans | 0.1 /100 | #272 | Tragic 1.4% |
| Alaskan Athabascans | 0.1 /100 | #273 | Tragic 1.5% |
| Iroquois | 0.0 /100 | #274 | Tragic 1.5% |
| Brazilians | 0.0 /100 | #275 | Tragic 1.5% |
| Greeks | 0.0 /100 | #276 | Tragic 1.5% |
| Canadians | 0.0 /100 | #277 | Tragic 1.5% |
| Kiowa | 0.0 /100 | #278 | Tragic 1.5% |
| Danes | 0.0 /100 | #279 | Tragic 1.5% |
| British | 0.0 /100 | #280 | Tragic 1.5% |
| Czechoslovakians | 0.0 /100 | #281 | Tragic 1.5% |
| Cheyenne | 0.0 /100 | #282 | Tragic 1.5% |
| Delaware | 0.0 /100 | #283 | Tragic 1.5% |