Turkish vs Greek Disability Age Under 5
COMPARE
Turkish
Greek
Disability Age Under 5
Disability Age Under 5 Comparison
Turks
Greeks
1.1%
DISABILITY AGE UNDER 5
98.0/ 100
METRIC RATING
81st/ 347
METRIC RANK
1.5%
DISABILITY AGE UNDER 5
0.0/ 100
METRIC RATING
276th/ 347
METRIC RANK
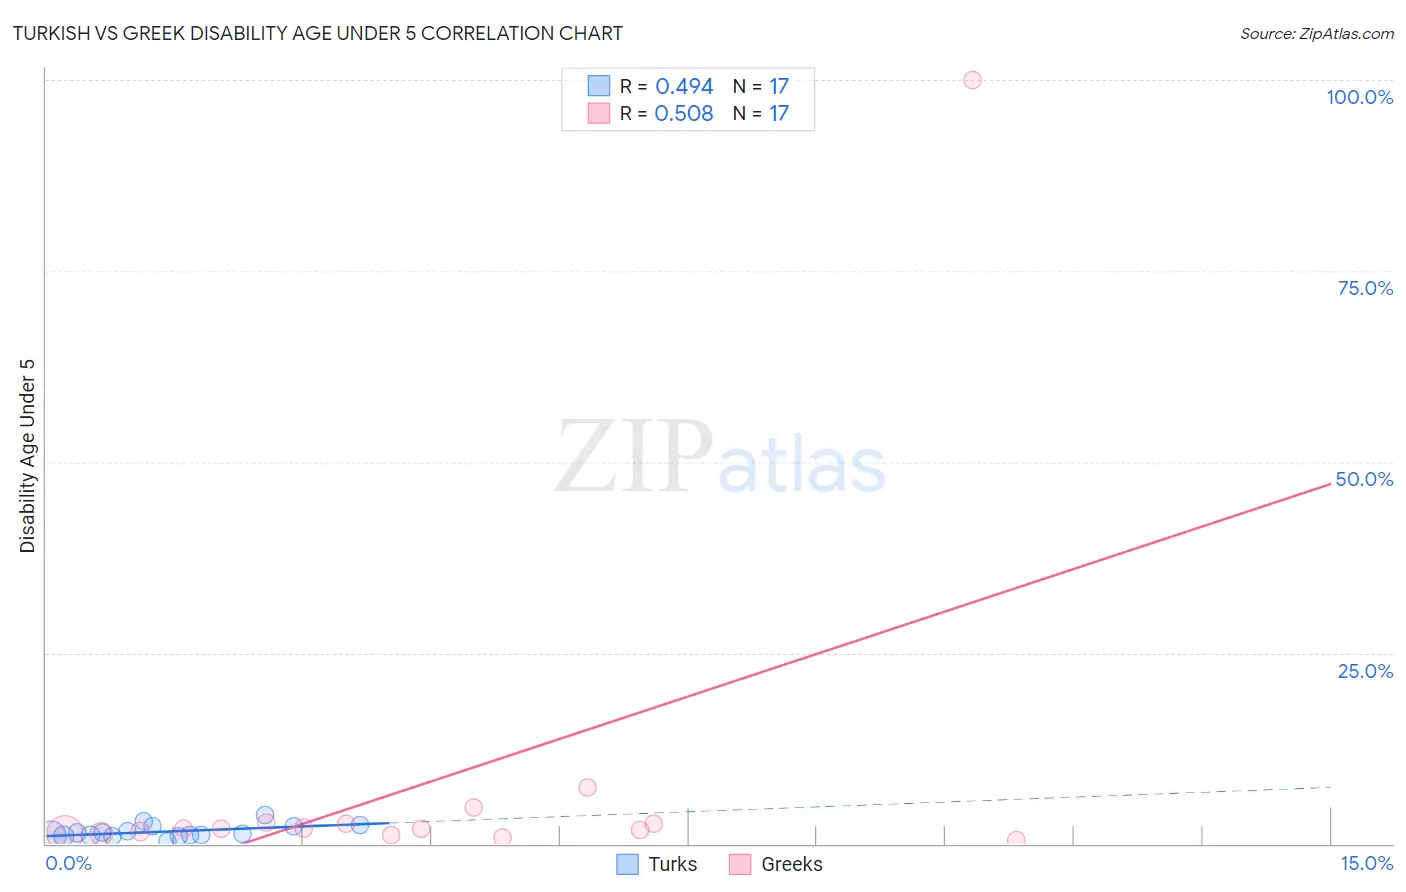
Turkish vs Greek Disability Age Under 5 Correlation Chart
The statistical analysis conducted on geographies consisting of 161,432,303 people shows a moderate positive correlation between the proportion of Turks and percentage of population with a disability under the age of 5 in the United States with a correlation coefficient (R) of 0.494 and weighted average of 1.1%. Similarly, the statistical analysis conducted on geographies consisting of 239,993,794 people shows a substantial positive correlation between the proportion of Greeks and percentage of population with a disability under the age of 5 in the United States with a correlation coefficient (R) of 0.508 and weighted average of 1.5%, a difference of 29.5%.
Disability Age Under 5 Correlation Summary
| Measurement | Turkish | Greek |
| Minimum | 0.31% | 0.57% |
| Maximum | 3.7% | 100.0% |
| Range | 3.4% | 99.4% |
| Mean | 1.6% | 8.0% |
| Median | 1.4% | 2.0% |
| Interquartile 25% (IQ1) | 1.0% | 1.3% |
| Interquartile 75% (IQ3) | 2.3% | 2.7% |
| Interquartile Range (IQR) | 1.2% | 1.4% |
| Standard Deviation (Sample) | 0.86% | 23.8% |
| Standard Deviation (Population) | 0.83% | 23.0% |
Similar Demographics by Disability Age Under 5
Demographics Similar to Turks by Disability Age Under 5
In terms of disability age under 5, the demographic groups most similar to Turks are Immigrants from Trinidad and Tobago (1.1%, a difference of 0.020%), Hmong (1.1%, a difference of 0.040%), West Indian (1.1%, a difference of 0.060%), Immigrants from Jordan (1.1%, a difference of 0.11%), and Immigrants from Syria (1.1%, a difference of 0.12%).
| Demographics | Rating | Rank | Disability Age Under 5 |
| Jordanians | 98.5 /100 | #74 | Exceptional 1.1% |
| Immigrants | Pakistan | 98.4 /100 | #75 | Exceptional 1.1% |
| Immigrants | Burma/Myanmar | 98.2 /100 | #76 | Exceptional 1.1% |
| Immigrants | Denmark | 98.1 /100 | #77 | Exceptional 1.1% |
| West Indians | 98.0 /100 | #78 | Exceptional 1.1% |
| Hmong | 98.0 /100 | #79 | Exceptional 1.1% |
| Immigrants | Trinidad and Tobago | 98.0 /100 | #80 | Exceptional 1.1% |
| Turks | 98.0 /100 | #81 | Exceptional 1.1% |
| Immigrants | Jordan | 97.9 /100 | #82 | Exceptional 1.1% |
| Immigrants | Syria | 97.9 /100 | #83 | Exceptional 1.1% |
| Immigrants | Zaire | 97.8 /100 | #84 | Exceptional 1.1% |
| Sudanese | 97.7 /100 | #85 | Exceptional 1.1% |
| Okinawans | 97.6 /100 | #86 | Exceptional 1.1% |
| Ugandans | 97.5 /100 | #87 | Exceptional 1.1% |
| Immigrants | Dominican Republic | 97.5 /100 | #88 | Exceptional 1.1% |
Demographics Similar to Greeks by Disability Age Under 5
In terms of disability age under 5, the demographic groups most similar to Greeks are Brazilian (1.5%, a difference of 0.57%), Iroquois (1.5%, a difference of 0.69%), Canadian (1.5%, a difference of 0.70%), Kiowa (1.5%, a difference of 0.78%), and Danish (1.5%, a difference of 0.79%).
| Demographics | Rating | Rank | Disability Age Under 5 |
| Austrians | 0.1 /100 | #269 | Tragic 1.4% |
| Immigrants | North America | 0.1 /100 | #270 | Tragic 1.4% |
| Immigrants | Canada | 0.1 /100 | #271 | Tragic 1.4% |
| Blacks/African Americans | 0.1 /100 | #272 | Tragic 1.4% |
| Alaskan Athabascans | 0.1 /100 | #273 | Tragic 1.5% |
| Iroquois | 0.0 /100 | #274 | Tragic 1.5% |
| Brazilians | 0.0 /100 | #275 | Tragic 1.5% |
| Greeks | 0.0 /100 | #276 | Tragic 1.5% |
| Canadians | 0.0 /100 | #277 | Tragic 1.5% |
| Kiowa | 0.0 /100 | #278 | Tragic 1.5% |
| Danes | 0.0 /100 | #279 | Tragic 1.5% |
| British | 0.0 /100 | #280 | Tragic 1.5% |
| Czechoslovakians | 0.0 /100 | #281 | Tragic 1.5% |
| Cheyenne | 0.0 /100 | #282 | Tragic 1.5% |
| Delaware | 0.0 /100 | #283 | Tragic 1.5% |