Central American Indian vs German Russian Disability
COMPARE
Central American Indian
German Russian
Disability
Disability Comparison
Central American Indians
German Russians
13.2%
DISABILITY
0.0/ 100
METRIC RATING
296th/ 347
METRIC RANK
12.3%
DISABILITY
0.8/ 100
METRIC RATING
254th/ 347
METRIC RANK
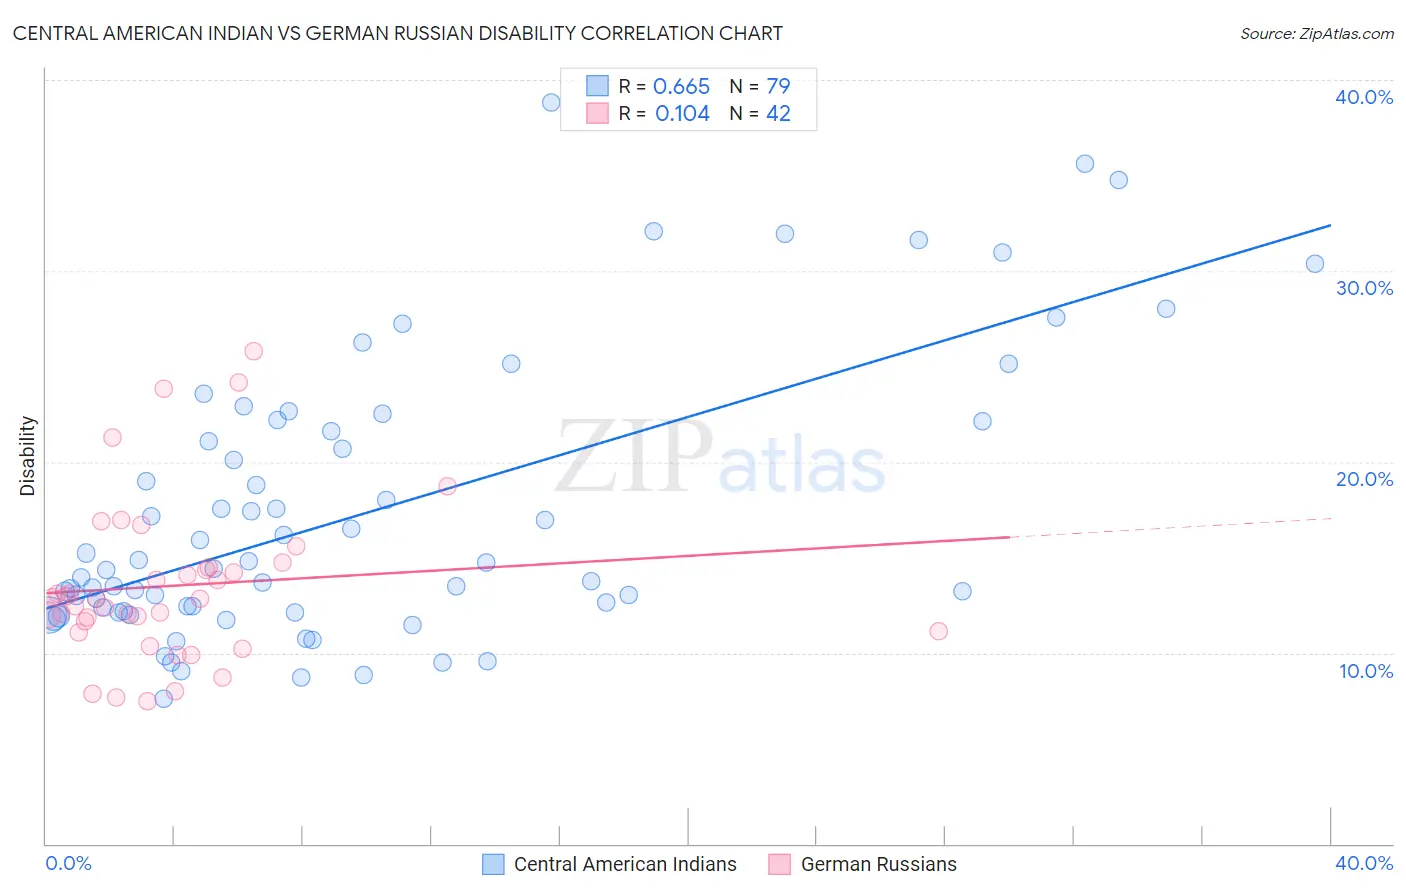
Central American Indian vs German Russian Disability Correlation Chart
The statistical analysis conducted on geographies consisting of 326,115,118 people shows a significant positive correlation between the proportion of Central American Indians and percentage of population with a disability in the United States with a correlation coefficient (R) of 0.665 and weighted average of 13.2%. Similarly, the statistical analysis conducted on geographies consisting of 96,458,633 people shows a poor positive correlation between the proportion of German Russians and percentage of population with a disability in the United States with a correlation coefficient (R) of 0.104 and weighted average of 12.3%, a difference of 6.8%.
Disability Correlation Summary
| Measurement | Central American Indian | German Russian |
| Minimum | 7.6% | 7.4% |
| Maximum | 38.8% | 25.8% |
| Range | 31.2% | 18.4% |
| Mean | 17.4% | 13.5% |
| Median | 14.4% | 12.8% |
| Interquartile 25% (IQ1) | 12.2% | 11.1% |
| Interquartile 75% (IQ3) | 22.1% | 14.5% |
| Interquartile Range (IQR) | 9.9% | 3.4% |
| Standard Deviation (Sample) | 7.3% | 4.2% |
| Standard Deviation (Population) | 7.3% | 4.2% |
Similar Demographics by Disability
Demographics Similar to Central American Indians by Disability
In terms of disability, the demographic groups most similar to Central American Indians are Nonimmigrants (13.2%, a difference of 0.040%), Hopi (13.2%, a difference of 0.060%), Alaska Native (13.2%, a difference of 0.070%), French (13.2%, a difference of 0.080%), and Pennsylvania German (13.2%, a difference of 0.13%).
| Demographics | Rating | Rank | Disability |
| Slovaks | 0.0 /100 | #289 | Tragic 13.0% |
| Cheyenne | 0.0 /100 | #290 | Tragic 13.0% |
| Yaqui | 0.0 /100 | #291 | Tragic 13.1% |
| Aleuts | 0.0 /100 | #292 | Tragic 13.1% |
| Marshallese | 0.0 /100 | #293 | Tragic 13.1% |
| Celtics | 0.0 /100 | #294 | Tragic 13.1% |
| Immigrants | Nonimmigrants | 0.0 /100 | #295 | Tragic 13.2% |
| Central American Indians | 0.0 /100 | #296 | Tragic 13.2% |
| Hopi | 0.0 /100 | #297 | Tragic 13.2% |
| Alaska Natives | 0.0 /100 | #298 | Tragic 13.2% |
| French | 0.0 /100 | #299 | Tragic 13.2% |
| Pennsylvania Germans | 0.0 /100 | #300 | Tragic 13.2% |
| Immigrants | Micronesia | 0.0 /100 | #301 | Tragic 13.2% |
| Arapaho | 0.0 /100 | #302 | Tragic 13.2% |
| Scotch-Irish | 0.0 /100 | #303 | Tragic 13.3% |
Demographics Similar to German Russians by Disability
In terms of disability, the demographic groups most similar to German Russians are Belgian (12.3%, a difference of 0.030%), Bermudan (12.3%, a difference of 0.33%), Slovene (12.4%, a difference of 0.33%), Immigrants from Dominica (12.4%, a difference of 0.39%), and Immigrants from Laos (12.4%, a difference of 0.49%).
| Demographics | Rating | Rank | Disability |
| Indonesians | 1.4 /100 | #247 | Tragic 12.2% |
| Guamanians/Chamorros | 1.4 /100 | #248 | Tragic 12.3% |
| Carpatho Rusyns | 1.4 /100 | #249 | Tragic 12.3% |
| Sub-Saharan Africans | 1.4 /100 | #250 | Tragic 12.3% |
| Europeans | 1.4 /100 | #251 | Tragic 12.3% |
| Bermudans | 1.1 /100 | #252 | Tragic 12.3% |
| Belgians | 0.8 /100 | #253 | Tragic 12.3% |
| German Russians | 0.8 /100 | #254 | Tragic 12.3% |
| Slovenes | 0.6 /100 | #255 | Tragic 12.4% |
| Immigrants | Dominica | 0.6 /100 | #256 | Tragic 12.4% |
| Immigrants | Laos | 0.5 /100 | #257 | Tragic 12.4% |
| Slavs | 0.5 /100 | #258 | Tragic 12.4% |
| Canadians | 0.4 /100 | #259 | Tragic 12.4% |
| Immigrants | Liberia | 0.4 /100 | #260 | Tragic 12.4% |
| Scandinavians | 0.4 /100 | #261 | Tragic 12.4% |