Central American Indian vs Immigrants from Chile Disability
COMPARE
Central American Indian
Immigrants from Chile
Disability
Disability Comparison
Central American Indians
Immigrants from Chile
13.2%
DISABILITY
0.0/ 100
METRIC RATING
296th/ 347
METRIC RANK
11.0%
DISABILITY
99.4/ 100
METRIC RATING
72nd/ 347
METRIC RANK
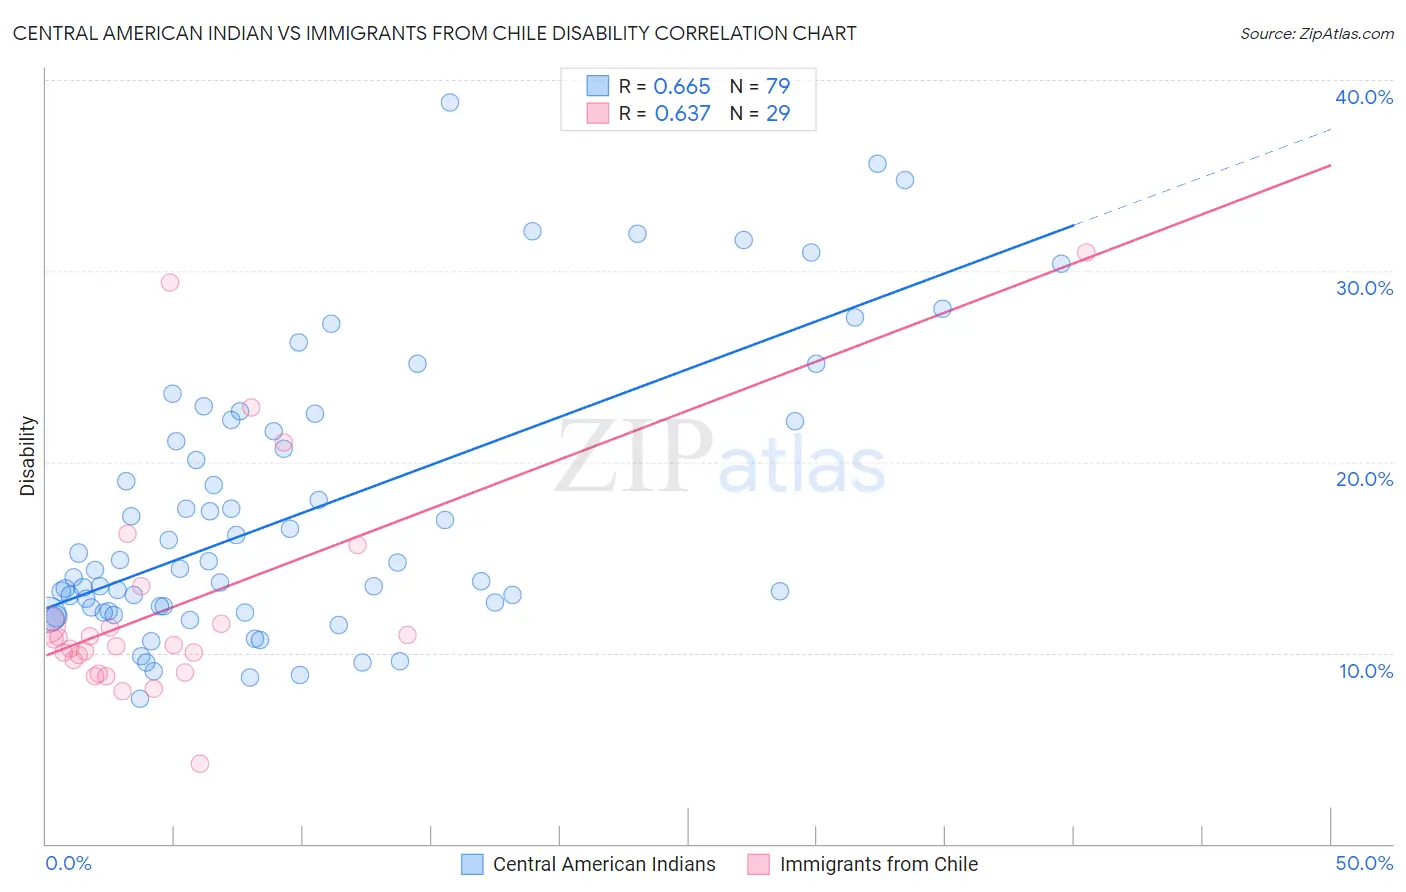
Central American Indian vs Immigrants from Chile Disability Correlation Chart
The statistical analysis conducted on geographies consisting of 326,115,118 people shows a significant positive correlation between the proportion of Central American Indians and percentage of population with a disability in the United States with a correlation coefficient (R) of 0.665 and weighted average of 13.2%. Similarly, the statistical analysis conducted on geographies consisting of 218,638,436 people shows a significant positive correlation between the proportion of Immigrants from Chile and percentage of population with a disability in the United States with a correlation coefficient (R) of 0.637 and weighted average of 11.0%, a difference of 19.2%.
Disability Correlation Summary
| Measurement | Central American Indian | Immigrants from Chile |
| Minimum | 7.6% | 4.2% |
| Maximum | 38.8% | 31.0% |
| Range | 31.2% | 26.8% |
| Mean | 17.4% | 12.5% |
| Median | 14.4% | 10.4% |
| Interquartile 25% (IQ1) | 12.2% | 9.3% |
| Interquartile 75% (IQ3) | 22.1% | 12.5% |
| Interquartile Range (IQR) | 9.9% | 3.2% |
| Standard Deviation (Sample) | 7.3% | 6.1% |
| Standard Deviation (Population) | 7.3% | 6.0% |
Similar Demographics by Disability
Demographics Similar to Central American Indians by Disability
In terms of disability, the demographic groups most similar to Central American Indians are Nonimmigrants (13.2%, a difference of 0.040%), Hopi (13.2%, a difference of 0.060%), Alaska Native (13.2%, a difference of 0.070%), French (13.2%, a difference of 0.080%), and Pennsylvania German (13.2%, a difference of 0.13%).
| Demographics | Rating | Rank | Disability |
| Slovaks | 0.0 /100 | #289 | Tragic 13.0% |
| Cheyenne | 0.0 /100 | #290 | Tragic 13.0% |
| Yaqui | 0.0 /100 | #291 | Tragic 13.1% |
| Aleuts | 0.0 /100 | #292 | Tragic 13.1% |
| Marshallese | 0.0 /100 | #293 | Tragic 13.1% |
| Celtics | 0.0 /100 | #294 | Tragic 13.1% |
| Immigrants | Nonimmigrants | 0.0 /100 | #295 | Tragic 13.2% |
| Central American Indians | 0.0 /100 | #296 | Tragic 13.2% |
| Hopi | 0.0 /100 | #297 | Tragic 13.2% |
| Alaska Natives | 0.0 /100 | #298 | Tragic 13.2% |
| French | 0.0 /100 | #299 | Tragic 13.2% |
| Pennsylvania Germans | 0.0 /100 | #300 | Tragic 13.2% |
| Immigrants | Micronesia | 0.0 /100 | #301 | Tragic 13.2% |
| Arapaho | 0.0 /100 | #302 | Tragic 13.2% |
| Scotch-Irish | 0.0 /100 | #303 | Tragic 13.3% |
Demographics Similar to Immigrants from Chile by Disability
In terms of disability, the demographic groups most similar to Immigrants from Chile are Immigrants from Bangladesh (11.0%, a difference of 0.030%), Immigrants from Serbia (11.0%, a difference of 0.040%), Immigrants from Vietnam (11.0%, a difference of 0.070%), Immigrants from Lebanon (11.0%, a difference of 0.090%), and Sierra Leonean (11.0%, a difference of 0.090%).
| Demographics | Rating | Rank | Disability |
| Bulgarians | 99.6 /100 | #65 | Exceptional 11.0% |
| Laotians | 99.6 /100 | #66 | Exceptional 11.0% |
| Colombians | 99.6 /100 | #67 | Exceptional 11.0% |
| Immigrants | Afghanistan | 99.6 /100 | #68 | Exceptional 11.0% |
| Sri Lankans | 99.5 /100 | #69 | Exceptional 11.0% |
| Immigrants | France | 99.4 /100 | #70 | Exceptional 11.0% |
| Immigrants | Lebanon | 99.4 /100 | #71 | Exceptional 11.0% |
| Immigrants | Chile | 99.4 /100 | #72 | Exceptional 11.0% |
| Immigrants | Bangladesh | 99.4 /100 | #73 | Exceptional 11.0% |
| Immigrants | Serbia | 99.4 /100 | #74 | Exceptional 11.0% |
| Immigrants | Vietnam | 99.4 /100 | #75 | Exceptional 11.0% |
| Sierra Leoneans | 99.3 /100 | #76 | Exceptional 11.0% |
| Immigrants | Belgium | 99.3 /100 | #77 | Exceptional 11.0% |
| Immigrants | Cameroon | 99.3 /100 | #78 | Exceptional 11.1% |
| Immigrants | Jordan | 99.3 /100 | #79 | Exceptional 11.1% |