Central American Indian vs Italian Divorced or Separated

COMPARE

Central American Indian
Race
Ancestry
AfghanAfricanAlaska NativeAlaskan AthabascanAlbanianAleutAlsatianAmericanApacheArabArapahoArgentineanArmenianAssyrian/Chaldean/SyriacAustralianAustrianBahamianBangladeshiBarbadianBasqueBelgianBelizeanBermudanBhutaneseBlackfeetBolivianBrazilianBritishBritish West IndianBulgarianBurmeseCajunCambodianCanadianCape VerdeanCarpatho RusynCelticCentral AmericanCentral American IndianCherokeeCheyenneChickasawChileanChineseChippewaChoctawColombianColvilleComancheCosta RicanCreeCreekCroatianCrowCubanCypriotCzechCzechoslovakianDanishDelawareDominicanDutchDutch West IndianEastern EuropeanEcuadorianEgyptianEnglishEstonianEthiopianEuropeanFijianFilipinoFinnishFrenchFrench American IndianFrench CanadianGermanGerman RussianGhanaianGreekGuamanian/ChamorroGuatemalanGuyaneseHaitianHmongHonduranHopiHoumaHungarianIcelanderIndian (Asian)IndonesianInupiatIranianIraqiIrishIroquoisIsraeliJamaicanJapaneseJordanianKenyanKiowaKoreanLaotianLatvianLebaneseLiberianLithuanianLumbeeLuxembourgerMacedonianMalaysianMalteseMarshalleseMenomineeMexicanMexican American IndianMongolianMoroccanNative HawaiianNavajoNepaleseNew ZealanderNicaraguanNigerianNorthern EuropeanNorwegianOkinawanOsageOttawaPaiutePakistaniPalestinianPanamanianParaguayanPennsylvania GermanPeruvianPimaPolishPortuguesePotawatomiPuebloPuerto RicanPuget Sound SalishRomanianRussianSalvadoranSamoanScandinavianScotch-IrishScottishSeminoleSenegaleseSerbianShoshoneSierra LeoneanSiouxSlavicSlovakSloveneSomaliSouth AfricanSouth AmericanSouth American IndianSoviet UnionSpaniardSpanishSpanish AmericanSpanish American IndianSri LankanSubsaharan AfricanSudaneseSwedishSwissSyrianTaiwaneseThaiTlingit-HaidaTohono O'OdhamTonganTrinidadian and TobagonianTsimshianTurkishU.S. Virgin IslanderUgandanUkrainianUruguayanUteVenezuelanVietnameseWelshWest IndianYakamaYaquiYugoslavianYumanYup'ikZimbabwean
Immigration
NonimmigrantsImmigrantsAfghanistanAfricaAlbaniaArgentinaArmeniaAsiaAustraliaAustriaBahamasBangladeshBarbadosBelarusBelgiumBelizeBoliviaBosnia and HerzegovinaBrazilBulgariaBurma/MyanmarCabo VerdeCambodiaCameroonCanadaCaribbeanCentral AmericaChileChinaColombiaCongoCosta RicaCroatiaCubaCzechoslovakiaDenmarkDominicaDominican RepublicEastern AfricaEastern AsiaEastern EuropeEcuadorEgyptEl SalvadorEnglandEritreaEthiopiaEuropeFijiFranceGermanyGhanaGreeceGrenadaGuatemalaGuyanaHaitiHondurasHong KongHungaryIndiaIndonesiaIranIraqIrelandIsraelItalyJamaicaJapanJordanKazakhstanKenyaKoreaKuwaitLaosLatin AmericaLatviaLebanonLiberiaLithuaniaMalaysiaMexicoMicronesiaMiddle AfricaMoldovaMoroccoNepalNetherlandsNicaraguaNigeriaNorth AmericaNorth MacedoniaNorthern AfricaNorthern EuropeNorwayOceaniaPakistanPanamaPeruPhilippinesPolandPortugalRomaniaRussiaSaudi ArabiaScotlandSenegalSerbiaSierra LeoneSingaporeSomaliaSouth AfricaSouth AmericaSouth Central AsiaSouth Eastern AsiaSouthern EuropeSpainSri LankaSt. Vincent and the GrenadinesSudanSwedenSwitzerlandSyriaTaiwanThailandTrinidad and TobagoTurkeyUgandaUkraineUruguayUzbekistanVenezuelaVietnamWest IndiesWestern AfricaWestern AsiaWestern EuropeYemenZaireZimbabweAzores
Italian
Race
Ancestry
AfghanAfricanAlaska NativeAlaskan AthabascanAlbanianAleutAlsatianAmericanApacheArabArapahoArgentineanArmenianAssyrian/Chaldean/SyriacAustralianAustrianBahamianBangladeshiBarbadianBasqueBelgianBelizeanBermudanBhutaneseBlackfeetBolivianBrazilianBritishBritish West IndianBulgarianBurmeseCajunCambodianCanadianCape VerdeanCarpatho RusynCelticCentral AmericanCherokeeCheyenneChickasawChileanChineseChippewaChoctawColombianColvilleComancheCosta RicanCreeCreekCroatianCrowCubanCypriotCzechCzechoslovakianDanishDelawareDominicanDutchDutch West IndianEastern EuropeanEcuadorianEgyptianEnglishEstonianEthiopianEuropeanFijianFilipinoFinnishFrenchFrench American IndianFrench CanadianGermanGerman RussianGhanaianGreekGuamanian/ChamorroGuatemalanGuyaneseHaitianHmongHonduranHopiHoumaHungarianIcelanderIndian (Asian)IndonesianInupiatIranianIraqiIrishIroquoisIsraeliItalianJamaicanJapaneseJordanianKenyanKiowaKoreanLaotianLatvianLebaneseLiberianLithuanianLumbeeLuxembourgerMacedonianMalaysianMalteseMarshalleseMenomineeMexicanMexican American IndianMongolianMoroccanNative HawaiianNavajoNepaleseNew ZealanderNicaraguanNigerianNorthern EuropeanNorwegianOkinawanOsageOttawaPaiutePakistaniPalestinianPanamanianParaguayanPennsylvania GermanPeruvianPimaPolishPortuguesePotawatomiPuebloPuerto RicanPuget Sound SalishRomanianRussianSalvadoranSamoanScandinavianScotch-IrishScottishSeminoleSenegaleseSerbianShoshoneSierra LeoneanSiouxSlavicSlovakSloveneSomaliSouth AfricanSouth AmericanSouth American IndianSoviet UnionSpaniardSpanishSpanish AmericanSpanish American IndianSri LankanSubsaharan AfricanSudaneseSwedishSwissSyrianTaiwaneseThaiTlingit-HaidaTohono O'OdhamTonganTrinidadian and TobagonianTsimshianTurkishU.S. Virgin IslanderUgandanUkrainianUruguayanUteVenezuelanVietnameseWelshWest IndianYakamaYaquiYugoslavianYumanYup'ikZimbabwean
Immigration
NonimmigrantsImmigrantsAfghanistanAfricaAlbaniaArgentinaArmeniaAsiaAustraliaAustriaBahamasBangladeshBarbadosBelarusBelgiumBelizeBoliviaBosnia and HerzegovinaBrazilBulgariaBurma/MyanmarCabo VerdeCambodiaCameroonCanadaCaribbeanCentral AmericaChileChinaColombiaCongoCosta RicaCroatiaCubaCzechoslovakiaDenmarkDominicaDominican RepublicEastern AfricaEastern AsiaEastern EuropeEcuadorEgyptEl SalvadorEnglandEritreaEthiopiaEuropeFijiFranceGermanyGhanaGreeceGrenadaGuatemalaGuyanaHaitiHondurasHong KongHungaryIndiaIndonesiaIranIraqIrelandIsraelItalyJamaicaJapanJordanKazakhstanKenyaKoreaKuwaitLaosLatin AmericaLatviaLebanonLiberiaLithuaniaMalaysiaMexicoMicronesiaMiddle AfricaMoldovaMoroccoNepalNetherlandsNicaraguaNigeriaNorth AmericaNorth MacedoniaNorthern AfricaNorthern EuropeNorwayOceaniaPakistanPanamaPeruPhilippinesPolandPortugalRomaniaRussiaSaudi ArabiaScotlandSenegalSerbiaSierra LeoneSingaporeSomaliaSouth AfricaSouth AmericaSouth Central AsiaSouth Eastern AsiaSouthern EuropeSpainSri LankaSt. Vincent and the GrenadinesSudanSwedenSwitzerlandSyriaTaiwanThailandTrinidad and TobagoTurkeyUgandaUkraineUruguayUzbekistanVenezuelaVietnamWest IndiesWestern AfricaWestern AsiaWestern EuropeYemenZaireZimbabweAzores
Divorced or Separated
Income
Poverty
Unemployment
Labor Participation
Family Structure
Vehicle Availability
Education Level
Disability

Divorced or Separated Comparison

Central American Indians

Italians

Tragic
Good
12.7%
DIVORCED OR SEPARATED
0.3/ 100
METRIC RATING
275th/ 347
METRIC RANK
11.9%
DIVORCED OR SEPARATED
77.8/ 100
METRIC RATING
148th/ 347
METRIC RANK

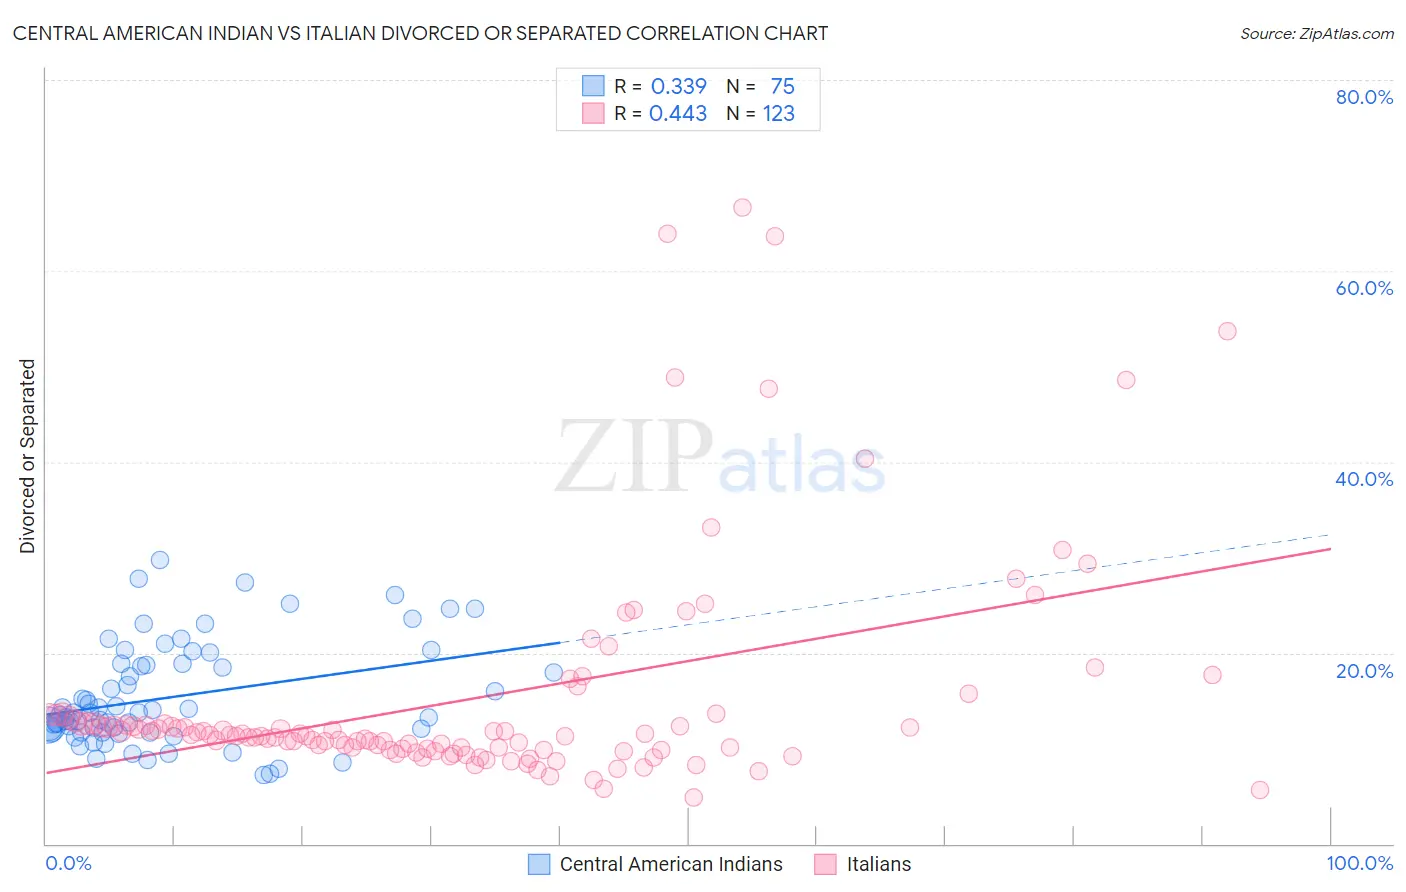
Central American Indian vs Italian Divorced or Separated Correlation Chart

The statistical analysis conducted on geographies consisting of 326,087,171 people shows a mild positive correlation between the proportion of Central American Indians and percentage of population currently divorced or separated in the United States with a correlation coefficient (R) of 0.339 and weighted average of 12.7%. Similarly, the statistical analysis conducted on geographies consisting of 574,595,053 people shows a moderate positive correlation between the proportion of Italians and percentage of population currently divorced or separated in the United States with a correlation coefficient (R) of 0.443 and weighted average of 11.9%, a difference of 6.3%.
Central American Indian vs Italian Divorced or Separated

Divorced or Separated Correlation Summary

MeasurementCentral American IndianItalian
Minimum7.2%4.8%
Maximum29.7%66.7%
Range22.5%61.9%
Mean15.3%15.1%
Median13.7%11.4%
Interquartile 25% (IQ1)11.7%10.0%
Interquartile 75% (IQ3)18.8%12.8%
Interquartile Range (IQR)7.1%2.9%
Standard Deviation (Sample)5.3%11.7%
Standard Deviation (Population)5.3%11.6%

Similar Demographics by Divorced or Separated

Demographics Similar to Central American Indians by Divorced or Separated

In terms of divorced or separated, the demographic groups most similar to Central American Indians are Bermudan (12.7%, a difference of 0.020%), Immigrants from Micronesia (12.7%, a difference of 0.040%), Spaniard (12.7%, a difference of 0.060%), Dominican (12.7%, a difference of 0.11%), and Immigrants from Middle Africa (12.7%, a difference of 0.16%).
DemographicsRating | RankDivorced or Separated
Fijians
0.4
/100
|
#268
Tragic
12.6%
Immigrants | Liberia
0.4
/100
|
#269
Tragic
12.6%
Ute
0.4
/100
|
#270
Tragic
12.6%
Panamanians
0.3
/100
|
#271
Tragic
12.7%
Immigrants | Middle Africa
0.3
/100
|
#272
Tragic
12.7%
Immigrants | Micronesia
0.3
/100
|
#273
Tragic
12.7%
Bermudans
0.3
/100
|
#274
Tragic
12.7%
Central American Indians
0.3
/100
|
#275
Tragic
12.7%
Spaniards
0.2
/100
|
#276
Tragic
12.7%
Dominicans
0.2
/100
|
#277
Tragic
12.7%
Lumbee
0.2
/100
|
#278
Tragic
12.7%
Immigrants | Dominican Republic
0.2
/100
|
#279
Tragic
12.7%
Immigrants | Zaire
0.2
/100
|
#280
Tragic
12.7%
Pueblo
0.2
/100
|
#281
Tragic
12.7%
Sub-Saharan Africans
0.1
/100
|
#282
Tragic
12.7%

Demographics Similar to Italians by Divorced or Separated

In terms of divorced or separated, the demographic groups most similar to Italians are Immigrants from Oceania (11.9%, a difference of 0.0%), Immigrants from Portugal (11.9%, a difference of 0.030%), Polish (11.9%, a difference of 0.040%), Immigrants from Grenada (11.9%, a difference of 0.070%), and Czech (11.9%, a difference of 0.070%).
DemographicsRating | RankDivorced or Separated
Immigrants | Morocco
82.9
/100
|
#141
Excellent
11.9%
Immigrants | Zimbabwe
81.5
/100
|
#142
Excellent
11.9%
Pakistanis
81.3
/100
|
#143
Excellent
11.9%
Peruvians
80.9
/100
|
#144
Excellent
11.9%
Croatians
80.6
/100
|
#145
Excellent
11.9%
Immigrants | Grenada
79.1
/100
|
#146
Good
11.9%
Poles
78.6
/100
|
#147
Good
11.9%
Italians
77.8
/100
|
#148
Good
11.9%
Immigrants | Oceania
77.7
/100
|
#149
Good
11.9%
Immigrants | Portugal
77.3
/100
|
#150
Good
11.9%
Czechs
76.4
/100
|
#151
Good
11.9%
Immigrants | Hungary
73.7
/100
|
#152
Good
11.9%
Austrians
72.2
/100
|
#153
Good
12.0%
Chileans
71.3
/100
|
#154
Good
12.0%
Japanese
70.9
/100
|
#155
Good
12.0%