Celtic vs Vietnamese 10th Grade

COMPARE

Celtic
Race
Ancestry
AfghanAfricanAlaska NativeAlaskan AthabascanAlbanianAleutAlsatianAmericanApacheArabArapahoArgentineanArmenianAssyrian/Chaldean/SyriacAustralianAustrianBahamianBangladeshiBarbadianBasqueBelgianBelizeanBermudanBhutaneseBlackfeetBolivianBrazilianBritishBritish West IndianBulgarianBurmeseCajunCambodianCanadianCape VerdeanCarpatho RusynCelticCentral AmericanCentral American IndianCherokeeCheyenneChickasawChileanChineseChippewaChoctawColombianColvilleComancheCosta RicanCreeCreekCroatianCrowCubanCypriotCzechCzechoslovakianDanishDelawareDominicanDutchDutch West IndianEastern EuropeanEcuadorianEgyptianEnglishEstonianEthiopianEuropeanFijianFilipinoFinnishFrenchFrench American IndianFrench CanadianGermanGerman RussianGhanaianGreekGuamanian/ChamorroGuatemalanGuyaneseHaitianHmongHonduranHopiHoumaHungarianIcelanderIndian (Asian)IndonesianInupiatIranianIraqiIrishIroquoisIsraeliItalianJamaicanJapaneseJordanianKenyanKiowaKoreanLaotianLatvianLebaneseLiberianLithuanianLumbeeLuxembourgerMacedonianMalaysianMalteseMarshalleseMenomineeMexicanMexican American IndianMongolianMoroccanNative HawaiianNavajoNepaleseNew ZealanderNicaraguanNigerianNorthern EuropeanNorwegianOkinawanOsageOttawaPaiutePakistaniPalestinianPanamanianParaguayanPennsylvania GermanPeruvianPimaPolishPortuguesePotawatomiPuebloPuerto RicanPuget Sound SalishRomanianRussianSalvadoranSamoanScandinavianScotch-IrishScottishSeminoleSenegaleseSerbianShoshoneSierra LeoneanSiouxSlavicSlovakSloveneSomaliSouth AfricanSouth AmericanSouth American IndianSoviet UnionSpaniardSpanishSpanish AmericanSpanish American IndianSri LankanSubsaharan AfricanSudaneseSwedishSwissSyrianTaiwaneseThaiTlingit-HaidaTohono O'OdhamTonganTrinidadian and TobagonianTsimshianTurkishU.S. Virgin IslanderUgandanUkrainianUruguayanUteVenezuelanWelshWest IndianYakamaYaquiYugoslavianYumanYup'ikZimbabwean
Immigration
NonimmigrantsImmigrantsAfghanistanAfricaAlbaniaArgentinaArmeniaAsiaAustraliaAustriaBahamasBangladeshBarbadosBelarusBelgiumBelizeBoliviaBosnia and HerzegovinaBrazilBulgariaBurma/MyanmarCabo VerdeCambodiaCameroonCanadaCaribbeanCentral AmericaChileChinaColombiaCongoCosta RicaCroatiaCubaCzechoslovakiaDenmarkDominicaDominican RepublicEastern AfricaEastern AsiaEastern EuropeEcuadorEgyptEl SalvadorEnglandEritreaEthiopiaEuropeFijiFranceGermanyGhanaGreeceGrenadaGuatemalaGuyanaHaitiHondurasHong KongHungaryIndiaIndonesiaIranIraqIrelandIsraelItalyJamaicaJapanJordanKazakhstanKenyaKoreaKuwaitLaosLatin AmericaLatviaLebanonLiberiaLithuaniaMalaysiaMexicoMicronesiaMiddle AfricaMoldovaMoroccoNepalNetherlandsNicaraguaNigeriaNorth AmericaNorth MacedoniaNorthern AfricaNorthern EuropeNorwayOceaniaPakistanPanamaPeruPhilippinesPolandPortugalRomaniaRussiaSaudi ArabiaScotlandSenegalSerbiaSierra LeoneSingaporeSomaliaSouth AfricaSouth AmericaSouth Central AsiaSouth Eastern AsiaSouthern EuropeSpainSri LankaSt. Vincent and the GrenadinesSudanSwedenSwitzerlandSyriaTaiwanThailandTrinidad and TobagoTurkeyUgandaUkraineUruguayUzbekistanVenezuelaVietnamWest IndiesWestern AfricaWestern AsiaWestern EuropeYemenZaireZimbabweAzores
Vietnamese
Race
Ancestry
AfghanAfricanAlaska NativeAlaskan AthabascanAlbanianAleutAlsatianAmericanApacheArabArapahoArgentineanArmenianAssyrian/Chaldean/SyriacAustralianAustrianBahamianBangladeshiBarbadianBasqueBelgianBelizeanBermudanBhutaneseBlackfeetBolivianBrazilianBritishBritish West IndianBulgarianBurmeseCajunCambodianCanadianCape VerdeanCarpatho RusynCentral AmericanCentral American IndianCherokeeCheyenneChickasawChileanChineseChippewaChoctawColombianColvilleComancheCosta RicanCreeCreekCroatianCrowCubanCypriotCzechCzechoslovakianDanishDelawareDominicanDutchDutch West IndianEastern EuropeanEcuadorianEgyptianEnglishEstonianEthiopianEuropeanFijianFilipinoFinnishFrenchFrench American IndianFrench CanadianGermanGerman RussianGhanaianGreekGuamanian/ChamorroGuatemalanGuyaneseHaitianHmongHonduranHopiHoumaHungarianIcelanderIndian (Asian)IndonesianInupiatIranianIraqiIrishIroquoisIsraeliItalianJamaicanJapaneseJordanianKenyanKiowaKoreanLaotianLatvianLebaneseLiberianLithuanianLumbeeLuxembourgerMacedonianMalaysianMalteseMarshalleseMenomineeMexicanMexican American IndianMongolianMoroccanNative HawaiianNavajoNepaleseNew ZealanderNicaraguanNigerianNorthern EuropeanNorwegianOkinawanOsageOttawaPaiutePakistaniPalestinianPanamanianParaguayanPennsylvania GermanPeruvianPimaPolishPortuguesePotawatomiPuebloPuerto RicanPuget Sound SalishRomanianRussianSalvadoranSamoanScandinavianScotch-IrishScottishSeminoleSenegaleseSerbianShoshoneSierra LeoneanSiouxSlavicSlovakSloveneSomaliSouth AfricanSouth AmericanSouth American IndianSoviet UnionSpaniardSpanishSpanish AmericanSpanish American IndianSri LankanSubsaharan AfricanSudaneseSwedishSwissSyrianTaiwaneseThaiTlingit-HaidaTohono O'OdhamTonganTrinidadian and TobagonianTsimshianTurkishU.S. Virgin IslanderUgandanUkrainianUruguayanUteVenezuelanVietnameseWelshWest IndianYakamaYaquiYugoslavianYumanYup'ikZimbabwean
Immigration
NonimmigrantsImmigrantsAfghanistanAfricaAlbaniaArgentinaArmeniaAsiaAustraliaAustriaBahamasBangladeshBarbadosBelarusBelgiumBelizeBoliviaBosnia and HerzegovinaBrazilBulgariaBurma/MyanmarCabo VerdeCambodiaCameroonCanadaCaribbeanCentral AmericaChileChinaColombiaCongoCosta RicaCroatiaCubaCzechoslovakiaDenmarkDominicaDominican RepublicEastern AfricaEastern AsiaEastern EuropeEcuadorEgyptEl SalvadorEnglandEritreaEthiopiaEuropeFijiFranceGermanyGhanaGreeceGrenadaGuatemalaGuyanaHaitiHondurasHong KongHungaryIndiaIndonesiaIranIraqIrelandIsraelItalyJamaicaJapanJordanKazakhstanKenyaKoreaKuwaitLaosLatin AmericaLatviaLebanonLiberiaLithuaniaMalaysiaMexicoMicronesiaMiddle AfricaMoldovaMoroccoNepalNetherlandsNicaraguaNigeriaNorth AmericaNorth MacedoniaNorthern AfricaNorthern EuropeNorwayOceaniaPakistanPanamaPeruPhilippinesPolandPortugalRomaniaRussiaSaudi ArabiaScotlandSenegalSerbiaSierra LeoneSingaporeSomaliaSouth AfricaSouth AmericaSouth Central AsiaSouth Eastern AsiaSouthern EuropeSpainSri LankaSt. Vincent and the GrenadinesSudanSwedenSwitzerlandSyriaTaiwanThailandTrinidad and TobagoTurkeyUgandaUkraineUruguayUzbekistanVenezuelaVietnamWest IndiesWestern AfricaWestern AsiaWestern EuropeYemenZaireZimbabweAzores
10th Grade
Income
Poverty
Unemployment
Labor Participation
Family Structure
Vehicle Availability
Education Level
Disability

10th Grade Comparison

Celtics

Vietnamese

Exceptional
Tragic
95.0%
10TH GRADE
99.8/ 100
METRIC RATING
59th/ 347
METRIC RANK
90.9%
10TH GRADE
0.0/ 100
METRIC RATING
310th/ 347
METRIC RANK

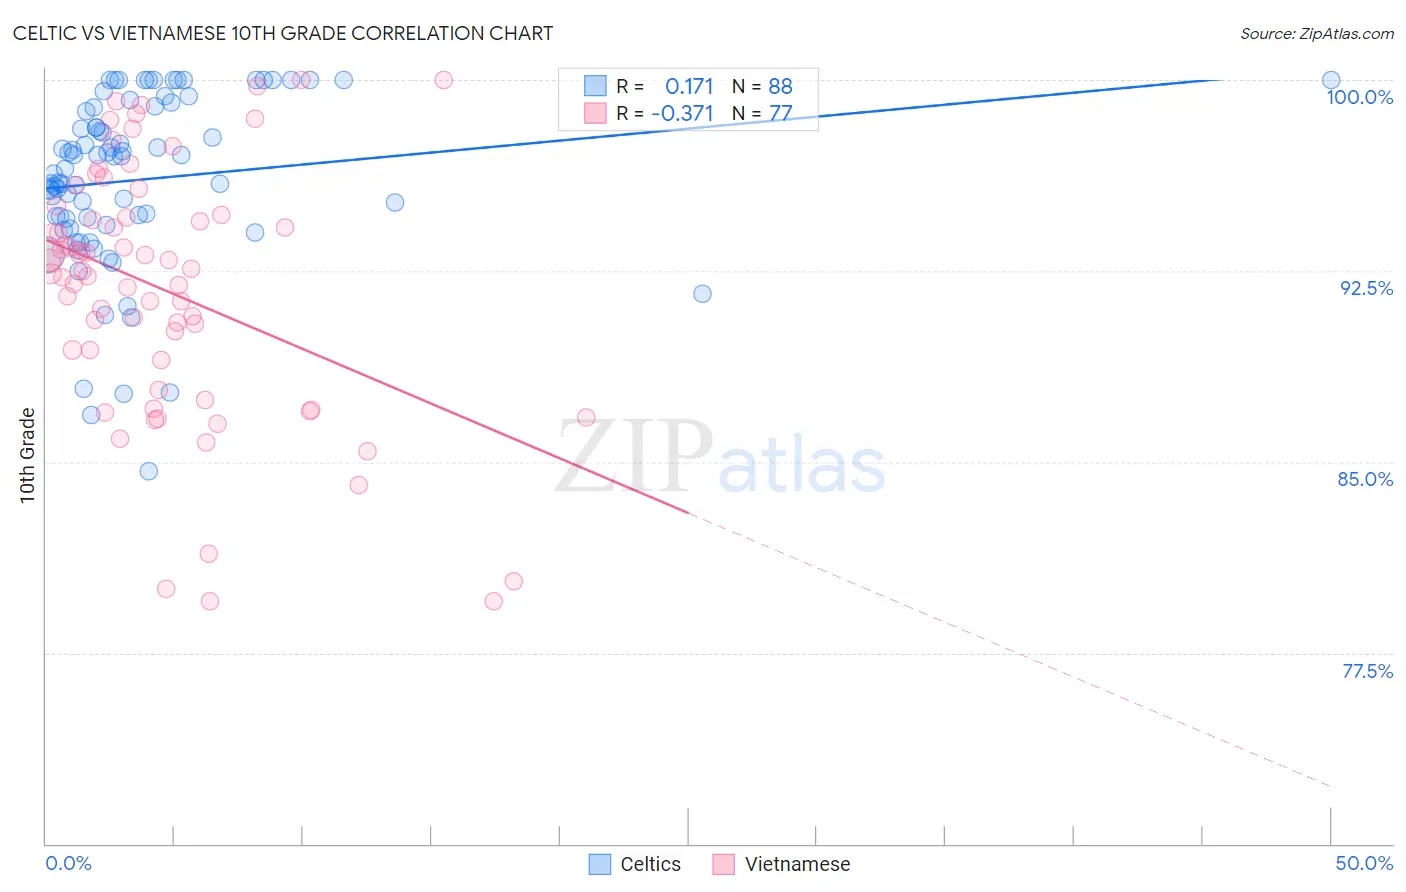
Celtic vs Vietnamese 10th Grade Correlation Chart

The statistical analysis conducted on geographies consisting of 168,876,981 people shows a poor positive correlation between the proportion of Celtics and percentage of population with at least 10th grade education in the United States with a correlation coefficient (R) of 0.171 and weighted average of 95.0%. Similarly, the statistical analysis conducted on geographies consisting of 170,728,240 people shows a mild negative correlation between the proportion of Vietnamese and percentage of population with at least 10th grade education in the United States with a correlation coefficient (R) of -0.371 and weighted average of 90.9%, a difference of 4.5%.
Celtic vs Vietnamese 10th Grade

10th Grade Correlation Summary

MeasurementCelticVietnamese
Minimum84.6%79.5%
Maximum100.0%100.0%
Range15.4%20.5%
Mean96.1%91.8%
Median96.8%92.5%
Interquartile 25% (IQ1)94.4%88.4%
Interquartile 75% (IQ3)98.9%94.6%
Interquartile Range (IQR)4.5%6.2%
Standard Deviation (Sample)3.4%5.0%
Standard Deviation (Population)3.4%4.9%

Similar Demographics by 10th Grade

Demographics Similar to Celtics by 10th Grade

In terms of 10th grade, the demographic groups most similar to Celtics are Aleut (95.0%, a difference of 0.0%), Immigrants from Ireland (95.0%, a difference of 0.010%), New Zealander (95.0%, a difference of 0.010%), Ukrainian (95.0%, a difference of 0.010%), and Cypriot (95.0%, a difference of 0.010%).
DemographicsRating | Rank10th Grade
Ottawa
99.8
/100
|
#52
Exceptional
95.1%
Immigrants | North America
99.8
/100
|
#53
Exceptional
95.0%
Immigrants | Lithuania
99.8
/100
|
#54
Exceptional
95.0%
Immigrants | Ireland
99.8
/100
|
#55
Exceptional
95.0%
New Zealanders
99.8
/100
|
#56
Exceptional
95.0%
Ukrainians
99.8
/100
|
#57
Exceptional
95.0%
Aleuts
99.8
/100
|
#58
Exceptional
95.0%
Celtics
99.8
/100
|
#59
Exceptional
95.0%
Cypriots
99.8
/100
|
#60
Exceptional
95.0%
Chippewa
99.8
/100
|
#61
Exceptional
95.0%
Thais
99.8
/100
|
#62
Exceptional
95.0%
Immigrants | Singapore
99.8
/100
|
#63
Exceptional
95.0%
Native Hawaiians
99.7
/100
|
#64
Exceptional
95.0%
Turks
99.7
/100
|
#65
Exceptional
95.0%
Immigrants | Australia
99.7
/100
|
#66
Exceptional
94.9%

Demographics Similar to Vietnamese by 10th Grade

In terms of 10th grade, the demographic groups most similar to Vietnamese are Immigrants from Cambodia (90.9%, a difference of 0.020%), Immigrants (91.0%, a difference of 0.040%), Immigrants from Bangladesh (91.0%, a difference of 0.080%), Immigrants from Fiji (91.0%, a difference of 0.090%), and Yaqui (91.1%, a difference of 0.15%).
DemographicsRating | Rank10th Grade
Immigrants | Vietnam
0.0
/100
|
#303
Tragic
91.2%
Pima
0.0
/100
|
#304
Tragic
91.2%
Immigrants | Dominica
0.0
/100
|
#305
Tragic
91.1%
Yaqui
0.0
/100
|
#306
Tragic
91.1%
Immigrants | Fiji
0.0
/100
|
#307
Tragic
91.0%
Immigrants | Bangladesh
0.0
/100
|
#308
Tragic
91.0%
Immigrants | Immigrants
0.0
/100
|
#309
Tragic
91.0%
Vietnamese
0.0
/100
|
#310
Tragic
90.9%
Immigrants | Cambodia
0.0
/100
|
#311
Tragic
90.9%
Immigrants | Portugal
0.0
/100
|
#312
Tragic
90.8%
Cape Verdeans
0.0
/100
|
#313
Tragic
90.8%
Nepalese
0.0
/100
|
#314
Tragic
90.7%
Immigrants | Caribbean
0.0
/100
|
#315
Tragic
90.6%
Ecuadorians
0.0
/100
|
#316
Tragic
90.6%
Immigrants | Ecuador
0.0
/100
|
#317
Tragic
90.4%