Immigrants from Korea vs Somali Female Disability
COMPARE
Immigrants from Korea
Somali
Female Disability
Female Disability Comparison
Immigrants from Korea
Somalis
10.6%
FEMALE DISABILITY
100.0/ 100
METRIC RATING
11th/ 347
METRIC RANK
12.3%
FEMALE DISABILITY
21.5/ 100
METRIC RATING
202nd/ 347
METRIC RANK
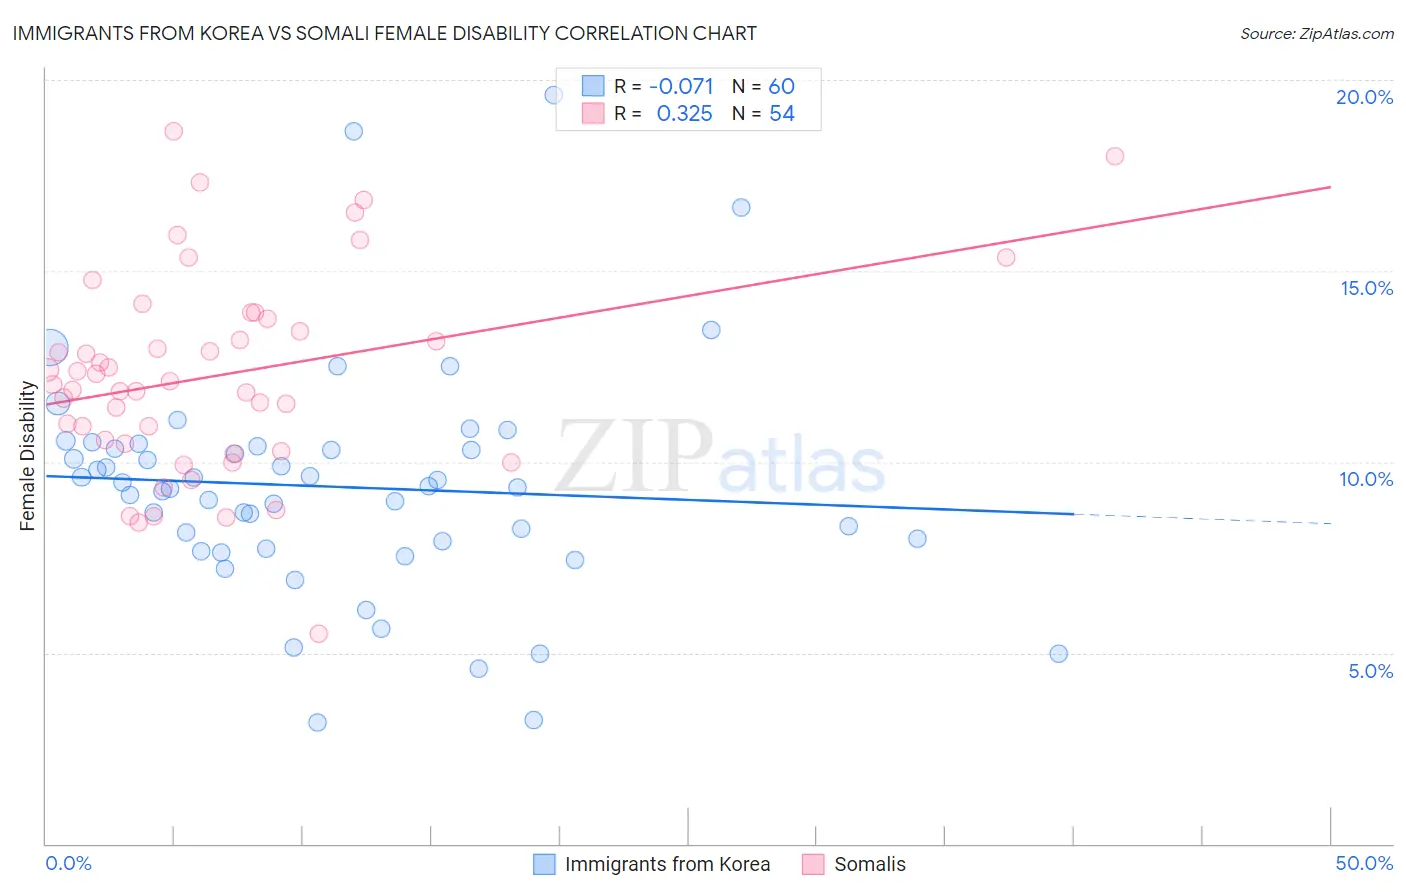
Immigrants from Korea vs Somali Female Disability Correlation Chart
The statistical analysis conducted on geographies consisting of 416,288,361 people shows a slight negative correlation between the proportion of Immigrants from Korea and percentage of females with a disability in the United States with a correlation coefficient (R) of -0.071 and weighted average of 10.6%. Similarly, the statistical analysis conducted on geographies consisting of 99,314,959 people shows a mild positive correlation between the proportion of Somalis and percentage of females with a disability in the United States with a correlation coefficient (R) of 0.325 and weighted average of 12.3%, a difference of 16.0%.
Female Disability Correlation Summary
| Measurement | Immigrants from Korea | Somali |
| Minimum | 3.2% | 5.5% |
| Maximum | 19.6% | 18.6% |
| Range | 16.4% | 13.1% |
| Mean | 9.4% | 12.3% |
| Median | 9.3% | 12.1% |
| Interquartile 25% (IQ1) | 7.8% | 10.5% |
| Interquartile 75% (IQ3) | 10.4% | 13.7% |
| Interquartile Range (IQR) | 2.6% | 3.3% |
| Standard Deviation (Sample) | 3.0% | 2.7% |
| Standard Deviation (Population) | 3.0% | 2.6% |
Similar Demographics by Female Disability
Demographics Similar to Immigrants from Korea by Female Disability
In terms of female disability, the demographic groups most similar to Immigrants from Korea are Immigrants from Hong Kong (10.6%, a difference of 0.17%), Immigrants from Israel (10.7%, a difference of 0.42%), Immigrants from Eastern Asia (10.7%, a difference of 0.49%), Immigrants from China (10.7%, a difference of 0.52%), and Iranian (10.6%, a difference of 0.82%).
| Demographics | Rating | Rank | Female Disability |
| Thais | 100.0 /100 | #4 | Exceptional 10.2% |
| Immigrants | Bolivia | 100.0 /100 | #5 | Exceptional 10.3% |
| Bolivians | 100.0 /100 | #6 | Exceptional 10.4% |
| Immigrants | Singapore | 100.0 /100 | #7 | Exceptional 10.4% |
| Immigrants | South Central Asia | 100.0 /100 | #8 | Exceptional 10.5% |
| Iranians | 100.0 /100 | #9 | Exceptional 10.6% |
| Immigrants | Hong Kong | 100.0 /100 | #10 | Exceptional 10.6% |
| Immigrants | Korea | 100.0 /100 | #11 | Exceptional 10.6% |
| Immigrants | Israel | 100.0 /100 | #12 | Exceptional 10.7% |
| Immigrants | Eastern Asia | 100.0 /100 | #13 | Exceptional 10.7% |
| Immigrants | China | 100.0 /100 | #14 | Exceptional 10.7% |
| Burmese | 100.0 /100 | #15 | Exceptional 10.7% |
| Okinawans | 100.0 /100 | #16 | Exceptional 10.8% |
| Indians (Asian) | 100.0 /100 | #17 | Exceptional 10.8% |
| Immigrants | Iran | 100.0 /100 | #18 | Exceptional 10.8% |
Demographics Similar to Somalis by Female Disability
In terms of female disability, the demographic groups most similar to Somalis are Immigrants from Barbados (12.3%, a difference of 0.020%), Chinese (12.3%, a difference of 0.030%), Trinidadian and Tobagonian (12.3%, a difference of 0.040%), Immigrants from Zaire (12.3%, a difference of 0.040%), and Immigrants from Grenada (12.4%, a difference of 0.060%).
| Demographics | Rating | Rank | Female Disability |
| Swedes | 26.6 /100 | #195 | Fair 12.3% |
| Immigrants | Panama | 25.5 /100 | #196 | Fair 12.3% |
| Hondurans | 25.4 /100 | #197 | Fair 12.3% |
| Mexican American Indians | 24.9 /100 | #198 | Fair 12.3% |
| Immigrants | Trinidad and Tobago | 24.7 /100 | #199 | Fair 12.3% |
| Trinidadians and Tobagonians | 22.4 /100 | #200 | Fair 12.3% |
| Chinese | 22.1 /100 | #201 | Fair 12.3% |
| Somalis | 21.5 /100 | #202 | Fair 12.3% |
| Immigrants | Barbados | 21.1 /100 | #203 | Fair 12.3% |
| Immigrants | Zaire | 20.9 /100 | #204 | Fair 12.3% |
| Immigrants | Grenada | 20.5 /100 | #205 | Fair 12.4% |
| Immigrants | Cuba | 20.2 /100 | #206 | Fair 12.4% |
| Croatians | 20.2 /100 | #207 | Fair 12.4% |
| Basques | 17.5 /100 | #208 | Poor 12.4% |
| Mexicans | 15.7 /100 | #209 | Poor 12.4% |