Spanish American vs Nicaraguan Ambulatory Disability
COMPARE
Spanish American
Nicaraguan
Ambulatory Disability
Ambulatory Disability Comparison
Spanish Americans
Nicaraguans
7.1%
AMBULATORY DISABILITY
0.0/ 100
METRIC RATING
307th/ 347
METRIC RANK
6.1%
AMBULATORY DISABILITY
63.2/ 100
METRIC RATING
165th/ 347
METRIC RANK
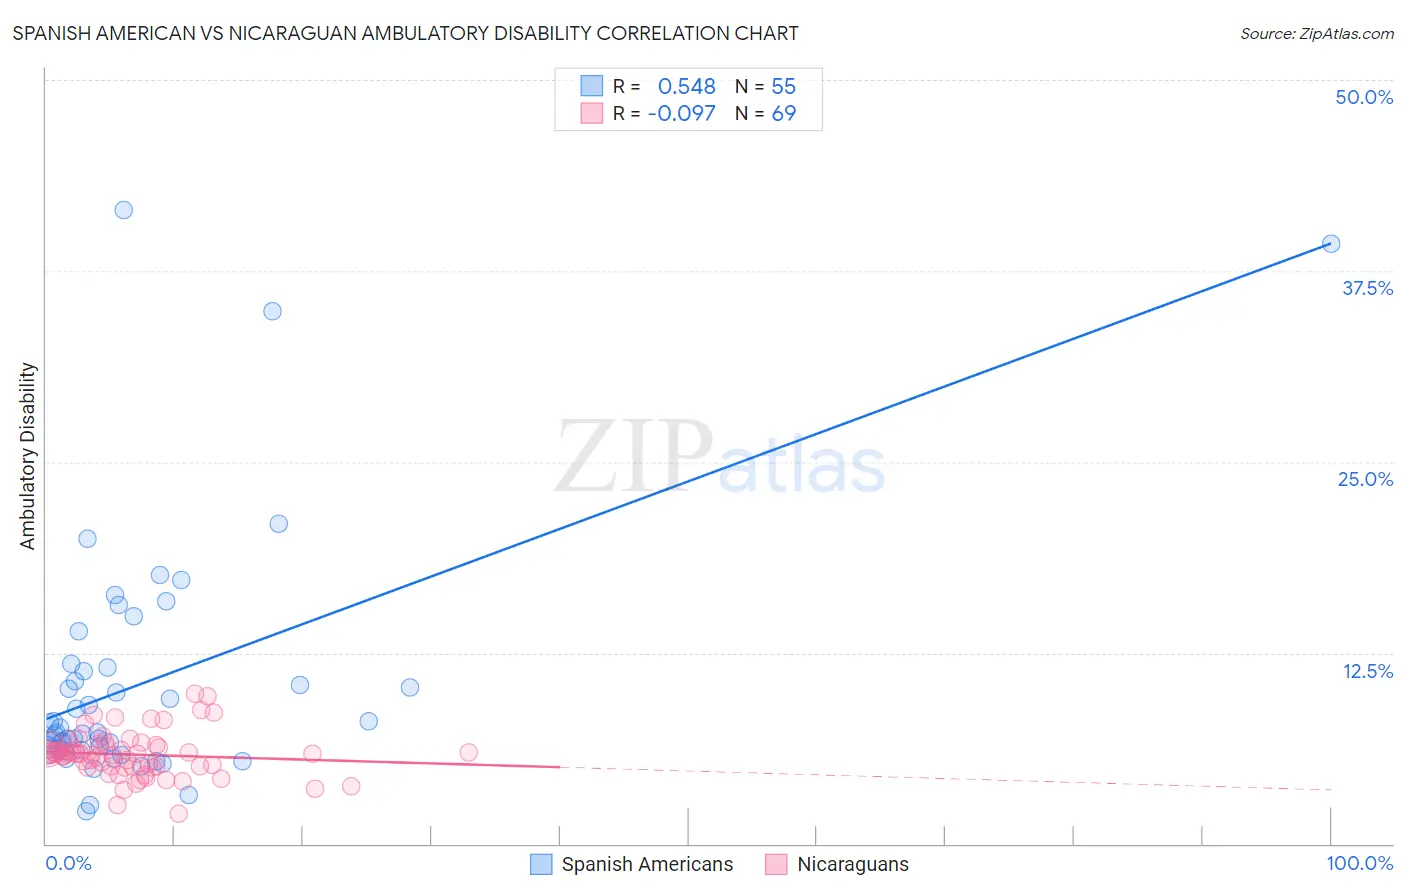
Spanish American vs Nicaraguan Ambulatory Disability Correlation Chart
The statistical analysis conducted on geographies consisting of 103,166,807 people shows a substantial positive correlation between the proportion of Spanish Americans and percentage of population with ambulatory disability in the United States with a correlation coefficient (R) of 0.548 and weighted average of 7.1%. Similarly, the statistical analysis conducted on geographies consisting of 285,681,314 people shows a slight negative correlation between the proportion of Nicaraguans and percentage of population with ambulatory disability in the United States with a correlation coefficient (R) of -0.097 and weighted average of 6.1%, a difference of 16.4%.
Ambulatory Disability Correlation Summary
| Measurement | Spanish American | Nicaraguan |
| Minimum | 2.1% | 2.0% |
| Maximum | 41.5% | 9.8% |
| Range | 39.4% | 7.8% |
| Mean | 10.5% | 5.8% |
| Median | 7.3% | 5.9% |
| Interquartile 25% (IQ1) | 6.1% | 5.0% |
| Interquartile 75% (IQ3) | 11.5% | 6.4% |
| Interquartile Range (IQR) | 5.4% | 1.4% |
| Standard Deviation (Sample) | 8.0% | 1.5% |
| Standard Deviation (Population) | 8.0% | 1.5% |
Similar Demographics by Ambulatory Disability
Demographics Similar to Spanish Americans by Ambulatory Disability
In terms of ambulatory disability, the demographic groups most similar to Spanish Americans are Chippewa (7.1%, a difference of 0.0%), Immigrants from the Azores (7.1%, a difference of 0.17%), Iroquois (7.1%, a difference of 0.26%), Arapaho (7.1%, a difference of 0.45%), and Cree (7.1%, a difference of 0.46%).
| Demographics | Rating | Rank | Ambulatory Disability |
| Marshallese | 0.0 /100 | #300 | Tragic 6.9% |
| British West Indians | 0.0 /100 | #301 | Tragic 7.0% |
| Immigrants | Armenia | 0.0 /100 | #302 | Tragic 7.0% |
| Africans | 0.0 /100 | #303 | Tragic 7.0% |
| Immigrants | Cabo Verde | 0.0 /100 | #304 | Tragic 7.0% |
| Immigrants | Micronesia | 0.0 /100 | #305 | Tragic 7.0% |
| Iroquois | 0.0 /100 | #306 | Tragic 7.1% |
| Spanish Americans | 0.0 /100 | #307 | Tragic 7.1% |
| Chippewa | 0.0 /100 | #308 | Tragic 7.1% |
| Immigrants | Azores | 0.0 /100 | #309 | Tragic 7.1% |
| Arapaho | 0.0 /100 | #310 | Tragic 7.1% |
| Cree | 0.0 /100 | #311 | Tragic 7.1% |
| Delaware | 0.0 /100 | #312 | Tragic 7.1% |
| Immigrants | Yemen | 0.0 /100 | #313 | Tragic 7.1% |
| Blackfeet | 0.0 /100 | #314 | Tragic 7.1% |
Demographics Similar to Nicaraguans by Ambulatory Disability
In terms of ambulatory disability, the demographic groups most similar to Nicaraguans are Iraqi (6.1%, a difference of 0.020%), Basque (6.1%, a difference of 0.030%), Immigrants from Oceania (6.1%, a difference of 0.14%), Ecuadorian (6.1%, a difference of 0.15%), and Lebanese (6.1%, a difference of 0.18%).
| Demographics | Rating | Rank | Ambulatory Disability |
| Immigrants | Fiji | 71.2 /100 | #158 | Good 6.0% |
| Immigrants | Latvia | 71.1 /100 | #159 | Good 6.0% |
| Central Americans | 69.8 /100 | #160 | Good 6.0% |
| Immigrants | Belarus | 69.2 /100 | #161 | Good 6.1% |
| Nigerians | 67.1 /100 | #162 | Good 6.1% |
| Lebanese | 66.2 /100 | #163 | Good 6.1% |
| Basques | 63.7 /100 | #164 | Good 6.1% |
| Nicaraguans | 63.2 /100 | #165 | Good 6.1% |
| Iraqis | 62.8 /100 | #166 | Good 6.1% |
| Immigrants | Oceania | 60.7 /100 | #167 | Good 6.1% |
| Ecuadorians | 60.5 /100 | #168 | Good 6.1% |
| Immigrants | Southern Europe | 58.1 /100 | #169 | Average 6.1% |
| Immigrants | Ecuador | 53.8 /100 | #170 | Average 6.1% |
| Moroccans | 52.6 /100 | #171 | Average 6.1% |
| Immigrants | Burma/Myanmar | 52.2 /100 | #172 | Average 6.1% |