Celtic vs Nicaraguan In Labor Force | Age 25-29
COMPARE
Celtic
Nicaraguan
In Labor Force | Age 25-29
In Labor Force | Age 25-29 Comparison
Celtics
Nicaraguans
84.7%
IN LABOR FORCE | AGE 25-29
52.5/ 100
METRIC RATING
169th/ 347
METRIC RANK
83.1%
IN LABOR FORCE | AGE 25-29
0.0/ 100
METRIC RATING
284th/ 347
METRIC RANK
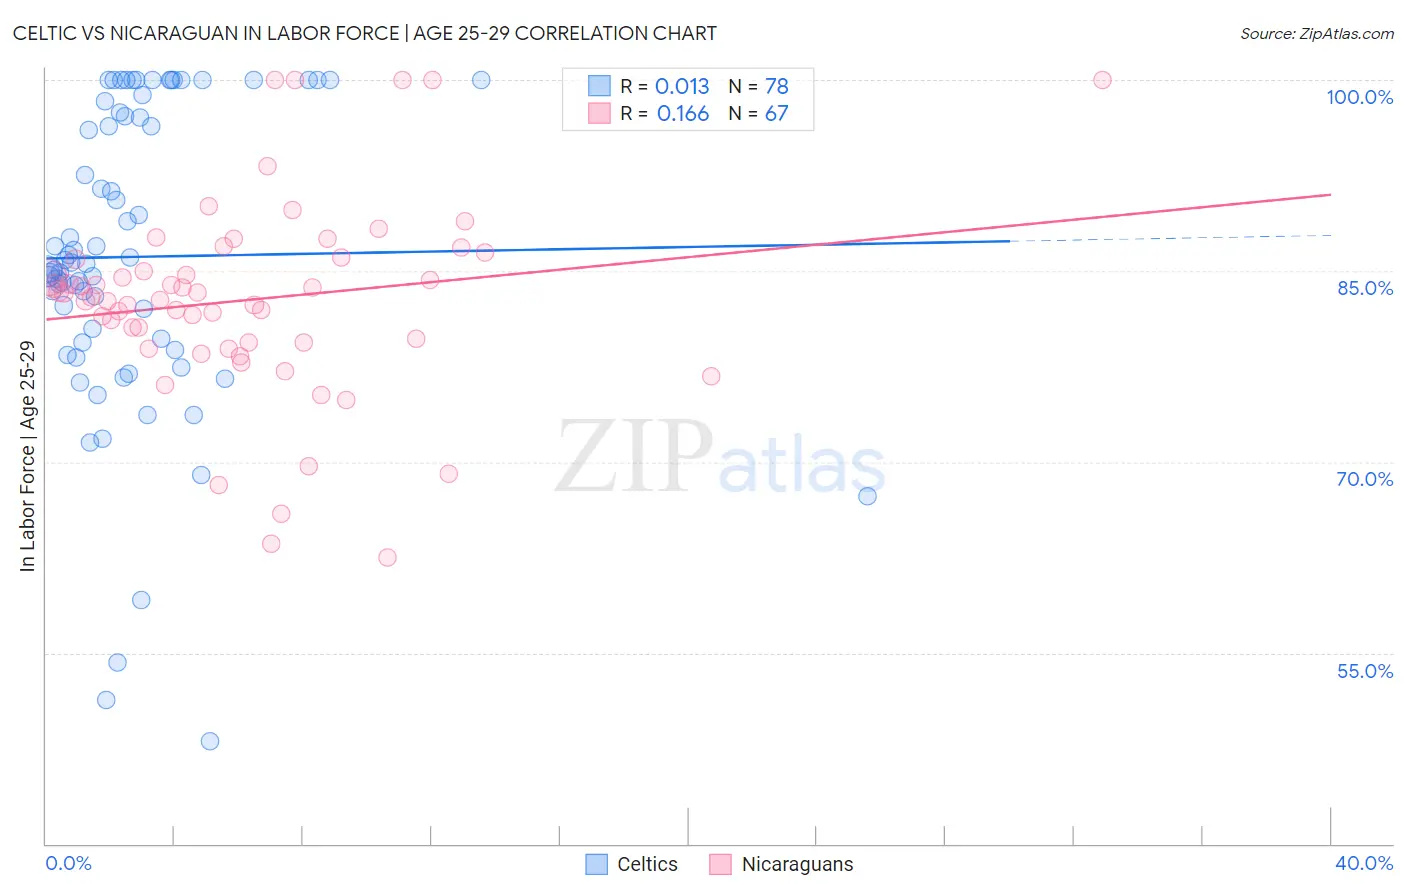
Celtic vs Nicaraguan In Labor Force | Age 25-29 Correlation Chart
The statistical analysis conducted on geographies consisting of 168,838,785 people shows no correlation between the proportion of Celtics and labor force participation rate among population between the ages 25 and 29 in the United States with a correlation coefficient (R) of 0.013 and weighted average of 84.7%. Similarly, the statistical analysis conducted on geographies consisting of 285,680,331 people shows a poor positive correlation between the proportion of Nicaraguans and labor force participation rate among population between the ages 25 and 29 in the United States with a correlation coefficient (R) of 0.166 and weighted average of 83.1%, a difference of 1.9%.
In Labor Force | Age 25-29 Correlation Summary
| Measurement | Celtic | Nicaraguan |
| Minimum | 48.1% | 62.5% |
| Maximum | 100.0% | 100.0% |
| Range | 51.9% | 37.5% |
| Mean | 86.1% | 82.7% |
| Median | 85.6% | 82.9% |
| Interquartile 25% (IQ1) | 79.4% | 79.4% |
| Interquartile 75% (IQ3) | 97.5% | 86.1% |
| Interquartile Range (IQR) | 18.0% | 6.7% |
| Standard Deviation (Sample) | 12.0% | 7.7% |
| Standard Deviation (Population) | 11.9% | 7.7% |
Similar Demographics by In Labor Force | Age 25-29
Demographics Similar to Celtics by In Labor Force | Age 25-29
In terms of in labor force | age 25-29, the demographic groups most similar to Celtics are Tongan (84.7%, a difference of 0.0%), Immigrants from Vietnam (84.7%, a difference of 0.010%), Immigrants from Western Europe (84.7%, a difference of 0.010%), South American (84.7%, a difference of 0.020%), and Assyrian/Chaldean/Syriac (84.7%, a difference of 0.020%).
| Demographics | Rating | Rank | In Labor Force | Age 25-29 |
| Immigrants | Colombia | 58.3 /100 | #162 | Average 84.7% |
| Argentineans | 57.9 /100 | #163 | Average 84.7% |
| Ghanaians | 57.6 /100 | #164 | Average 84.7% |
| Immigrants | Burma/Myanmar | 57.4 /100 | #165 | Average 84.7% |
| Immigrants | Spain | 56.9 /100 | #166 | Average 84.7% |
| Indonesians | 56.5 /100 | #167 | Average 84.7% |
| South Americans | 54.9 /100 | #168 | Average 84.7% |
| Celtics | 52.5 /100 | #169 | Average 84.7% |
| Tongans | 52.4 /100 | #170 | Average 84.7% |
| Immigrants | Vietnam | 50.5 /100 | #171 | Average 84.7% |
| Immigrants | Western Europe | 50.4 /100 | #172 | Average 84.7% |
| Assyrians/Chaldeans/Syriacs | 50.2 /100 | #173 | Average 84.7% |
| Palestinians | 50.0 /100 | #174 | Average 84.7% |
| Hungarians | 47.8 /100 | #175 | Average 84.6% |
| Malaysians | 46.8 /100 | #176 | Average 84.6% |
Demographics Similar to Nicaraguans by In Labor Force | Age 25-29
In terms of in labor force | age 25-29, the demographic groups most similar to Nicaraguans are American (83.1%, a difference of 0.020%), Immigrants from the Azores (83.1%, a difference of 0.020%), Immigrants from Dominican Republic (83.1%, a difference of 0.030%), Belizean (83.1%, a difference of 0.030%), and Mexican American Indian (83.0%, a difference of 0.050%).
| Demographics | Rating | Rank | In Labor Force | Age 25-29 |
| Africans | 0.0 /100 | #277 | Tragic 83.2% |
| Immigrants | Cuba | 0.0 /100 | #278 | Tragic 83.2% |
| British West Indians | 0.0 /100 | #279 | Tragic 83.2% |
| Dominicans | 0.0 /100 | #280 | Tragic 83.2% |
| Immigrants | Dominican Republic | 0.0 /100 | #281 | Tragic 83.1% |
| Americans | 0.0 /100 | #282 | Tragic 83.1% |
| Immigrants | Azores | 0.0 /100 | #283 | Tragic 83.1% |
| Nicaraguans | 0.0 /100 | #284 | Tragic 83.1% |
| Belizeans | 0.0 /100 | #285 | Tragic 83.1% |
| Mexican American Indians | 0.0 /100 | #286 | Tragic 83.0% |
| Guyanese | 0.0 /100 | #287 | Tragic 83.0% |
| Ottawa | 0.0 /100 | #288 | Tragic 83.0% |
| Immigrants | Micronesia | 0.0 /100 | #289 | Tragic 83.0% |
| Immigrants | Bangladesh | 0.0 /100 | #290 | Tragic 83.0% |
| Hawaiians | 0.0 /100 | #291 | Tragic 83.0% |