Polish vs Immigrants from Trinidad and Tobago Disability
COMPARE
Polish
Immigrants from Trinidad and Tobago
Disability
Disability Comparison
Poles
Immigrants from Trinidad and Tobago
12.2%
DISABILITY
1.7/ 100
METRIC RATING
242nd/ 347
METRIC RANK
11.7%
DISABILITY
58.9/ 100
METRIC RATING
163rd/ 347
METRIC RANK
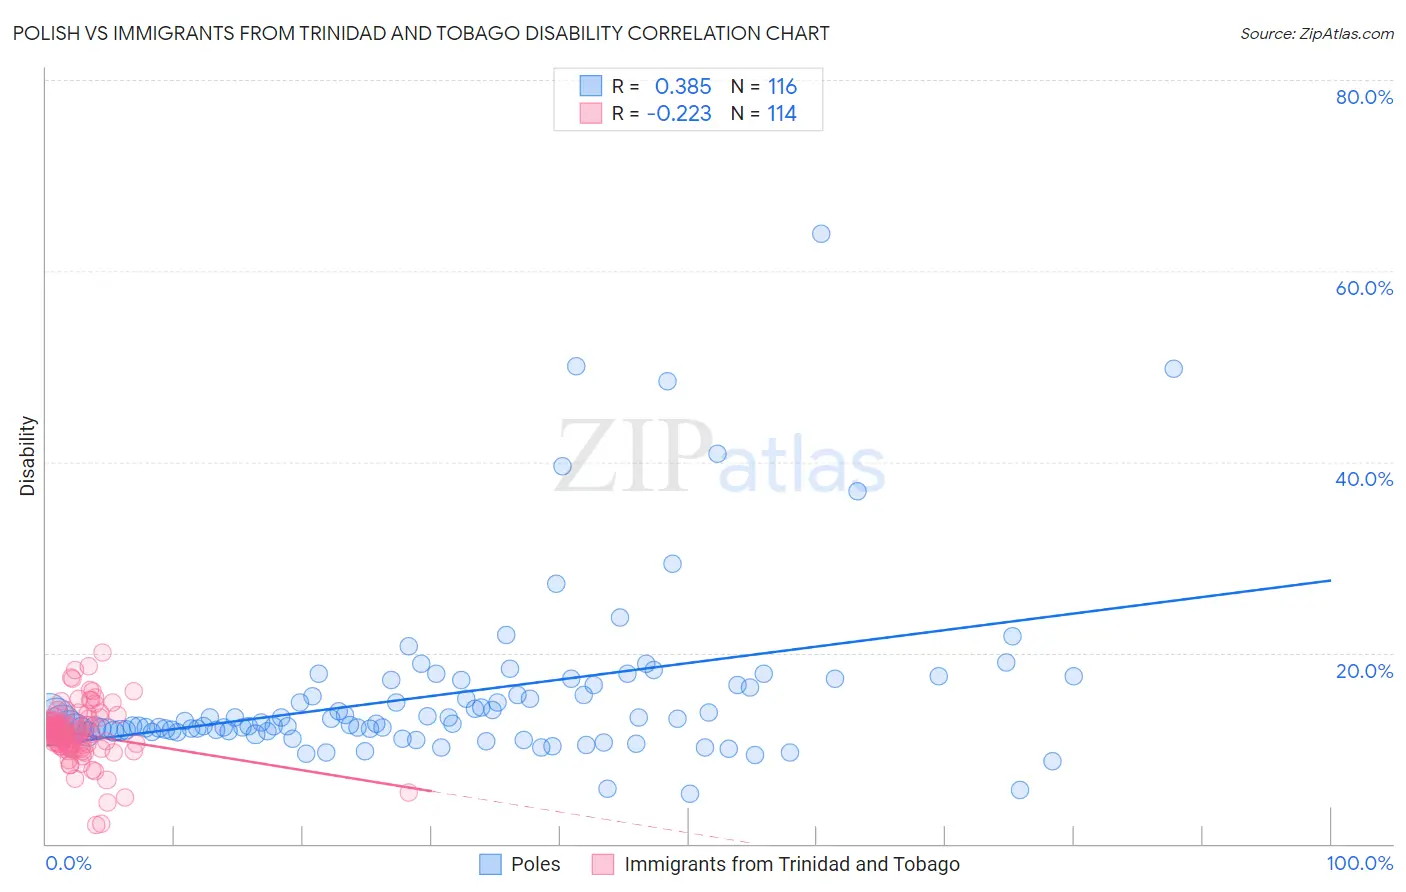
Polish vs Immigrants from Trinidad and Tobago Disability Correlation Chart
The statistical analysis conducted on geographies consisting of 560,456,636 people shows a mild positive correlation between the proportion of Poles and percentage of population with a disability in the United States with a correlation coefficient (R) of 0.385 and weighted average of 12.2%. Similarly, the statistical analysis conducted on geographies consisting of 223,506,024 people shows a weak negative correlation between the proportion of Immigrants from Trinidad and Tobago and percentage of population with a disability in the United States with a correlation coefficient (R) of -0.223 and weighted average of 11.7%, a difference of 4.9%.
Disability Correlation Summary
| Measurement | Polish | Immigrants from Trinidad and Tobago |
| Minimum | 5.3% | 2.0% |
| Maximum | 63.9% | 20.0% |
| Range | 58.6% | 18.0% |
| Mean | 15.6% | 11.5% |
| Median | 12.7% | 11.6% |
| Interquartile 25% (IQ1) | 11.8% | 10.3% |
| Interquartile 75% (IQ3) | 16.6% | 12.7% |
| Interquartile Range (IQR) | 4.8% | 2.5% |
| Standard Deviation (Sample) | 9.1% | 2.9% |
| Standard Deviation (Population) | 9.0% | 2.9% |
Similar Demographics by Disability
Demographics Similar to Poles by Disability
In terms of disability, the demographic groups most similar to Poles are Hungarian (12.2%, a difference of 0.020%), Yugoslavian (12.2%, a difference of 0.020%), Swedish (12.2%, a difference of 0.080%), British (12.2%, a difference of 0.090%), and Basque (12.2%, a difference of 0.090%).
| Demographics | Rating | Rank | Disability |
| Yup'ik | 2.2 /100 | #235 | Tragic 12.2% |
| Chinese | 2.0 /100 | #236 | Tragic 12.2% |
| Immigrants | Congo | 1.9 /100 | #237 | Tragic 12.2% |
| Norwegians | 1.9 /100 | #238 | Tragic 12.2% |
| Swedes | 1.8 /100 | #239 | Tragic 12.2% |
| Hungarians | 1.7 /100 | #240 | Tragic 12.2% |
| Yugoslavians | 1.7 /100 | #241 | Tragic 12.2% |
| Poles | 1.7 /100 | #242 | Tragic 12.2% |
| British | 1.5 /100 | #243 | Tragic 12.2% |
| Basques | 1.5 /100 | #244 | Tragic 12.2% |
| Liberians | 1.5 /100 | #245 | Tragic 12.2% |
| Swiss | 1.5 /100 | #246 | Tragic 12.2% |
| Indonesians | 1.4 /100 | #247 | Tragic 12.2% |
| Guamanians/Chamorros | 1.4 /100 | #248 | Tragic 12.3% |
| Carpatho Rusyns | 1.4 /100 | #249 | Tragic 12.3% |
Demographics Similar to Immigrants from Trinidad and Tobago by Disability
In terms of disability, the demographic groups most similar to Immigrants from Trinidad and Tobago are Immigrants from Haiti (11.7%, a difference of 0.020%), Syrian (11.7%, a difference of 0.020%), Cuban (11.7%, a difference of 0.10%), Immigrants from Cuba (11.6%, a difference of 0.19%), and Pakistani (11.7%, a difference of 0.19%).
| Demographics | Rating | Rank | Disability |
| Immigrants | Fiji | 69.5 /100 | #156 | Good 11.6% |
| Immigrants | Middle Africa | 69.5 /100 | #157 | Good 11.6% |
| Armenians | 65.9 /100 | #158 | Good 11.6% |
| Guatemalans | 65.1 /100 | #159 | Good 11.6% |
| Immigrants | Barbados | 64.2 /100 | #160 | Good 11.6% |
| Immigrants | Cuba | 62.8 /100 | #161 | Good 11.6% |
| Immigrants | Haiti | 59.2 /100 | #162 | Average 11.7% |
| Immigrants | Trinidad and Tobago | 58.9 /100 | #163 | Average 11.7% |
| Syrians | 58.5 /100 | #164 | Average 11.7% |
| Cubans | 56.7 /100 | #165 | Average 11.7% |
| Pakistanis | 54.7 /100 | #166 | Average 11.7% |
| Estonians | 54.4 /100 | #167 | Average 11.7% |
| Immigrants | Latin America | 54.1 /100 | #168 | Average 11.7% |
| Immigrants | Austria | 53.4 /100 | #169 | Average 11.7% |
| Immigrants | Albania | 52.8 /100 | #170 | Average 11.7% |