Puget Sound Salish vs Immigrants from Trinidad and Tobago Disability
COMPARE
Puget Sound Salish
Immigrants from Trinidad and Tobago
Disability
Disability Comparison
Puget Sound Salish
Immigrants from Trinidad and Tobago
13.7%
DISABILITY
0.0/ 100
METRIC RATING
315th/ 347
METRIC RANK
11.7%
DISABILITY
58.9/ 100
METRIC RATING
163rd/ 347
METRIC RANK
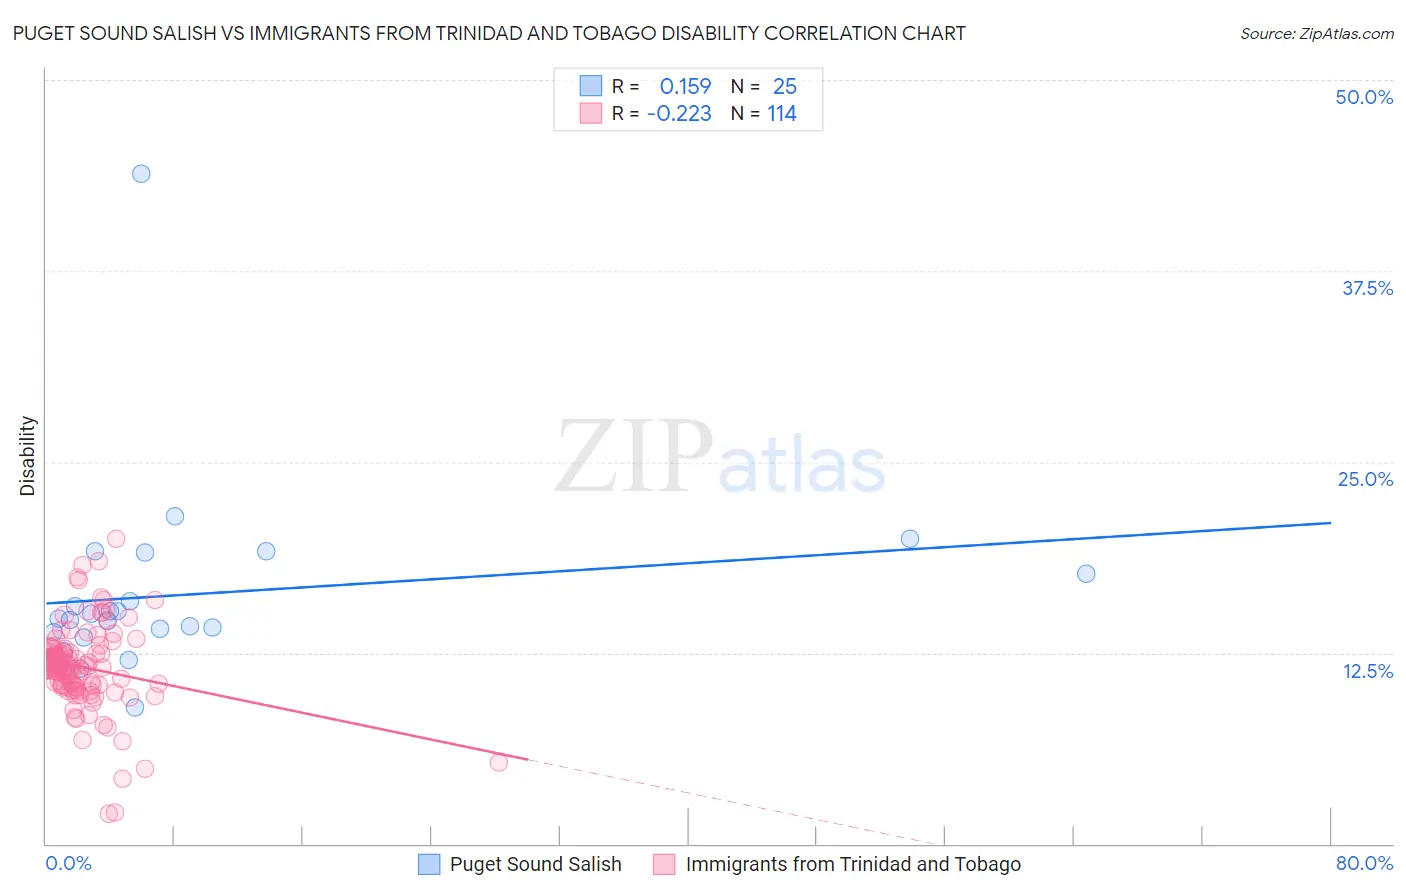
Puget Sound Salish vs Immigrants from Trinidad and Tobago Disability Correlation Chart
The statistical analysis conducted on geographies consisting of 46,152,398 people shows a poor positive correlation between the proportion of Puget Sound Salish and percentage of population with a disability in the United States with a correlation coefficient (R) of 0.159 and weighted average of 13.7%. Similarly, the statistical analysis conducted on geographies consisting of 223,506,024 people shows a weak negative correlation between the proportion of Immigrants from Trinidad and Tobago and percentage of population with a disability in the United States with a correlation coefficient (R) of -0.223 and weighted average of 11.7%, a difference of 17.6%.
Disability Correlation Summary
| Measurement | Puget Sound Salish | Immigrants from Trinidad and Tobago |
| Minimum | 8.9% | 2.0% |
| Maximum | 43.9% | 20.0% |
| Range | 35.0% | 18.0% |
| Mean | 16.3% | 11.5% |
| Median | 14.8% | 11.6% |
| Interquartile 25% (IQ1) | 13.7% | 10.3% |
| Interquartile 75% (IQ3) | 18.4% | 12.7% |
| Interquartile Range (IQR) | 4.7% | 2.5% |
| Standard Deviation (Sample) | 6.4% | 2.9% |
| Standard Deviation (Population) | 6.3% | 2.9% |
Similar Demographics by Disability
Demographics Similar to Puget Sound Salish by Disability
In terms of disability, the demographic groups most similar to Puget Sound Salish are Black/African American (13.7%, a difference of 0.0%), Pima (13.7%, a difference of 0.030%), Immigrants from Cabo Verde (13.7%, a difference of 0.030%), Cree (13.7%, a difference of 0.040%), and Spanish American (13.6%, a difference of 0.39%).
| Demographics | Rating | Rank | Disability |
| French American Indians | 0.0 /100 | #308 | Tragic 13.5% |
| Tlingit-Haida | 0.0 /100 | #309 | Tragic 13.5% |
| Blackfeet | 0.0 /100 | #310 | Tragic 13.6% |
| Delaware | 0.0 /100 | #311 | Tragic 13.6% |
| Spanish Americans | 0.0 /100 | #312 | Tragic 13.6% |
| Cree | 0.0 /100 | #313 | Tragic 13.7% |
| Blacks/African Americans | 0.0 /100 | #314 | Tragic 13.7% |
| Puget Sound Salish | 0.0 /100 | #315 | Tragic 13.7% |
| Pima | 0.0 /100 | #316 | Tragic 13.7% |
| Immigrants | Cabo Verde | 0.0 /100 | #317 | Tragic 13.7% |
| Menominee | 0.0 /100 | #318 | Tragic 13.8% |
| Iroquois | 0.0 /100 | #319 | Tragic 13.8% |
| Apache | 0.0 /100 | #320 | Tragic 13.9% |
| Paiute | 0.0 /100 | #321 | Tragic 13.9% |
| Americans | 0.0 /100 | #322 | Tragic 13.9% |
Demographics Similar to Immigrants from Trinidad and Tobago by Disability
In terms of disability, the demographic groups most similar to Immigrants from Trinidad and Tobago are Immigrants from Haiti (11.7%, a difference of 0.020%), Syrian (11.7%, a difference of 0.020%), Cuban (11.7%, a difference of 0.10%), Immigrants from Cuba (11.6%, a difference of 0.19%), and Pakistani (11.7%, a difference of 0.19%).
| Demographics | Rating | Rank | Disability |
| Immigrants | Fiji | 69.5 /100 | #156 | Good 11.6% |
| Immigrants | Middle Africa | 69.5 /100 | #157 | Good 11.6% |
| Armenians | 65.9 /100 | #158 | Good 11.6% |
| Guatemalans | 65.1 /100 | #159 | Good 11.6% |
| Immigrants | Barbados | 64.2 /100 | #160 | Good 11.6% |
| Immigrants | Cuba | 62.8 /100 | #161 | Good 11.6% |
| Immigrants | Haiti | 59.2 /100 | #162 | Average 11.7% |
| Immigrants | Trinidad and Tobago | 58.9 /100 | #163 | Average 11.7% |
| Syrians | 58.5 /100 | #164 | Average 11.7% |
| Cubans | 56.7 /100 | #165 | Average 11.7% |
| Pakistanis | 54.7 /100 | #166 | Average 11.7% |
| Estonians | 54.4 /100 | #167 | Average 11.7% |
| Immigrants | Latin America | 54.1 /100 | #168 | Average 11.7% |
| Immigrants | Austria | 53.4 /100 | #169 | Average 11.7% |
| Immigrants | Albania | 52.8 /100 | #170 | Average 11.7% |