Celtic vs Immigrants from Trinidad and Tobago Child Poverty Among Girls Under 16
COMPARE
Celtic
Immigrants from Trinidad and Tobago
Child Poverty Among Girls Under 16
Child Poverty Among Girls Under 16 Comparison
Celtics
Immigrants from Trinidad and Tobago
17.0%
CHILD POVERTY AMONG GIRLS UNDER 16
25.2/ 100
METRIC RATING
196th/ 347
METRIC RANK
19.2%
CHILD POVERTY AMONG GIRLS UNDER 16
0.3/ 100
METRIC RATING
251st/ 347
METRIC RANK
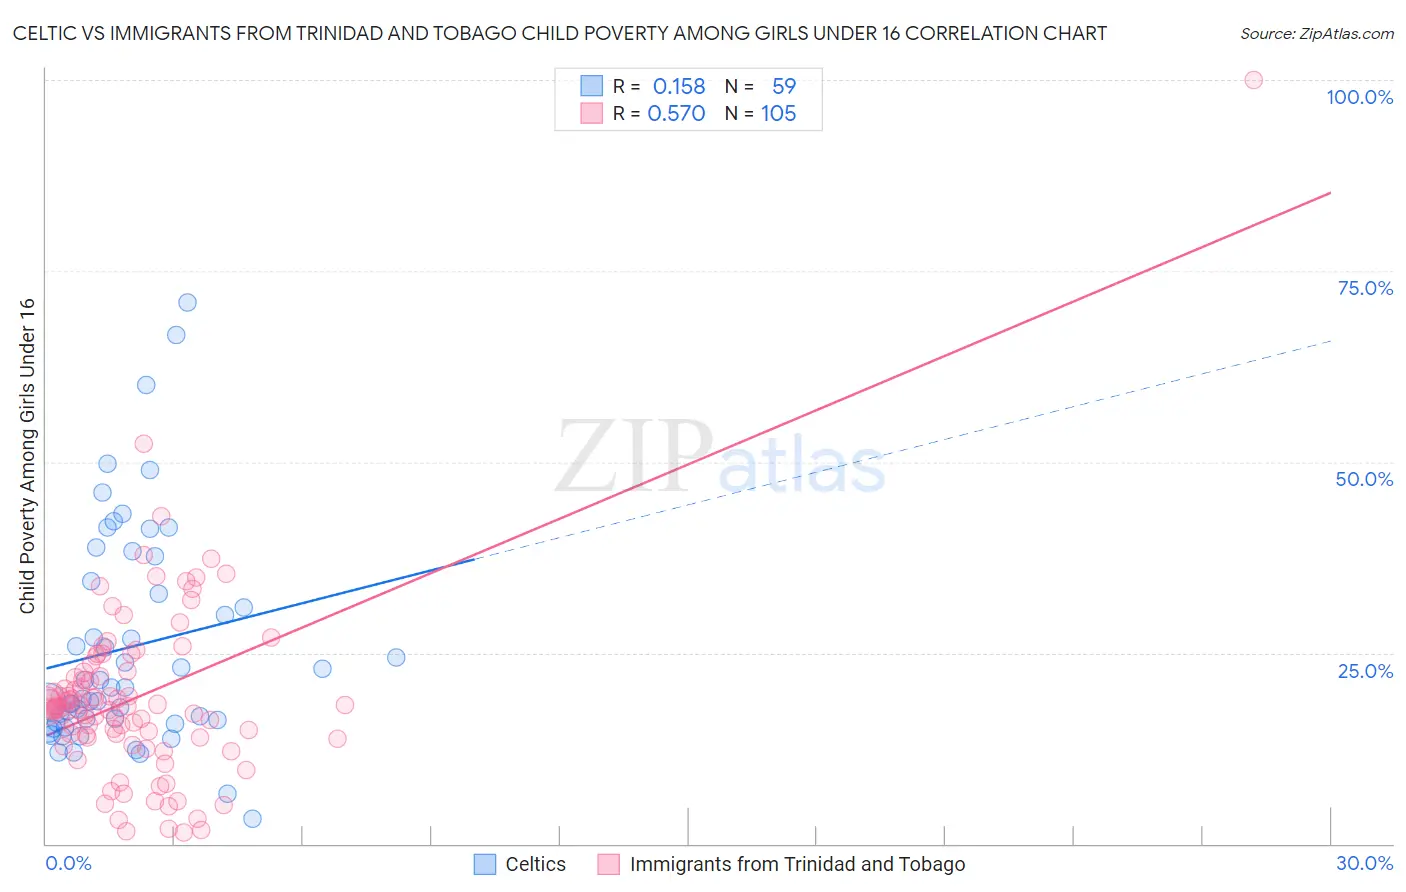
Celtic vs Immigrants from Trinidad and Tobago Child Poverty Among Girls Under 16 Correlation Chart
The statistical analysis conducted on geographies consisting of 167,177,387 people shows a poor positive correlation between the proportion of Celtics and poverty level among girls under the age of 16 in the United States with a correlation coefficient (R) of 0.158 and weighted average of 17.0%. Similarly, the statistical analysis conducted on geographies consisting of 221,127,815 people shows a substantial positive correlation between the proportion of Immigrants from Trinidad and Tobago and poverty level among girls under the age of 16 in the United States with a correlation coefficient (R) of 0.570 and weighted average of 19.2%, a difference of 13.3%.
Child Poverty Among Girls Under 16 Correlation Summary
| Measurement | Celtic | Immigrants from Trinidad and Tobago |
| Minimum | 3.3% | 1.5% |
| Maximum | 70.9% | 100.0% |
| Range | 67.6% | 98.5% |
| Mean | 25.7% | 19.2% |
| Median | 20.4% | 17.8% |
| Interquartile 25% (IQ1) | 15.9% | 13.9% |
| Interquartile 75% (IQ3) | 34.3% | 22.5% |
| Interquartile Range (IQR) | 18.4% | 8.6% |
| Standard Deviation (Sample) | 14.5% | 12.2% |
| Standard Deviation (Population) | 14.3% | 12.1% |
Similar Demographics by Child Poverty Among Girls Under 16
Demographics Similar to Celtics by Child Poverty Among Girls Under 16
In terms of child poverty among girls under 16, the demographic groups most similar to Celtics are Immigrants from Costa Rica (17.0%, a difference of 0.050%), Spaniard (17.0%, a difference of 0.050%), Immigrants from Lebanon (17.1%, a difference of 0.41%), Immigrants from Afghanistan (17.1%, a difference of 0.43%), and Spanish (16.9%, a difference of 0.48%).
| Demographics | Rating | Rank | Child Poverty Among Girls Under 16 |
| Immigrants | Bosnia and Herzegovina | 32.5 /100 | #189 | Fair 16.8% |
| Kenyans | 32.3 /100 | #190 | Fair 16.8% |
| Immigrants | Azores | 31.3 /100 | #191 | Fair 16.8% |
| Immigrants | Uganda | 31.3 /100 | #192 | Fair 16.8% |
| Aleuts | 28.7 /100 | #193 | Fair 16.9% |
| Spanish | 28.6 /100 | #194 | Fair 16.9% |
| Immigrants | Costa Rica | 25.6 /100 | #195 | Fair 17.0% |
| Celtics | 25.2 /100 | #196 | Fair 17.0% |
| Spaniards | 24.9 /100 | #197 | Fair 17.0% |
| Immigrants | Lebanon | 22.6 /100 | #198 | Fair 17.1% |
| Immigrants | Afghanistan | 22.4 /100 | #199 | Fair 17.1% |
| Immigrants | Uzbekistan | 21.5 /100 | #200 | Fair 17.1% |
| Immigrants | Kenya | 17.8 /100 | #201 | Poor 17.2% |
| Immigrants | Sierra Leone | 17.6 /100 | #202 | Poor 17.2% |
| Ugandans | 17.5 /100 | #203 | Poor 17.2% |
Demographics Similar to Immigrants from Trinidad and Tobago by Child Poverty Among Girls Under 16
In terms of child poverty among girls under 16, the demographic groups most similar to Immigrants from Trinidad and Tobago are Immigrants from Middle Africa (19.2%, a difference of 0.040%), Cape Verdean (19.2%, a difference of 0.11%), Potawatomi (19.2%, a difference of 0.14%), French American Indian (19.2%, a difference of 0.16%), and Immigrants from Guyana (19.3%, a difference of 0.23%).
| Demographics | Rating | Rank | Child Poverty Among Girls Under 16 |
| Ecuadorians | 0.7 /100 | #244 | Tragic 18.8% |
| Shoshone | 0.6 /100 | #245 | Tragic 18.9% |
| Immigrants | Laos | 0.6 /100 | #246 | Tragic 18.9% |
| Immigrants | Ghana | 0.5 /100 | #247 | Tragic 18.9% |
| French American Indians | 0.3 /100 | #248 | Tragic 19.2% |
| Potawatomi | 0.3 /100 | #249 | Tragic 19.2% |
| Cape Verdeans | 0.3 /100 | #250 | Tragic 19.2% |
| Immigrants | Trinidad and Tobago | 0.3 /100 | #251 | Tragic 19.2% |
| Immigrants | Middle Africa | 0.3 /100 | #252 | Tragic 19.2% |
| Immigrants | Guyana | 0.3 /100 | #253 | Tragic 19.3% |
| Immigrants | Western Africa | 0.3 /100 | #254 | Tragic 19.3% |
| Immigrants | Ecuador | 0.3 /100 | #255 | Tragic 19.3% |
| Trinidadians and Tobagonians | 0.2 /100 | #256 | Tragic 19.3% |
| Guyanese | 0.2 /100 | #257 | Tragic 19.4% |
| Salvadorans | 0.2 /100 | #258 | Tragic 19.4% |