Celtic vs Immigrants from Thailand Disability Age 65 to 74
COMPARE
Celtic
Immigrants from Thailand
Disability Age 65 to 74
Disability Age 65 to 74 Comparison
Celtics
Immigrants from Thailand
24.2%
DISABILITY AGE 65 TO 74
6.4/ 100
METRIC RATING
229th/ 347
METRIC RANK
24.3%
DISABILITY AGE 65 TO 74
5.2/ 100
METRIC RATING
231st/ 347
METRIC RANK
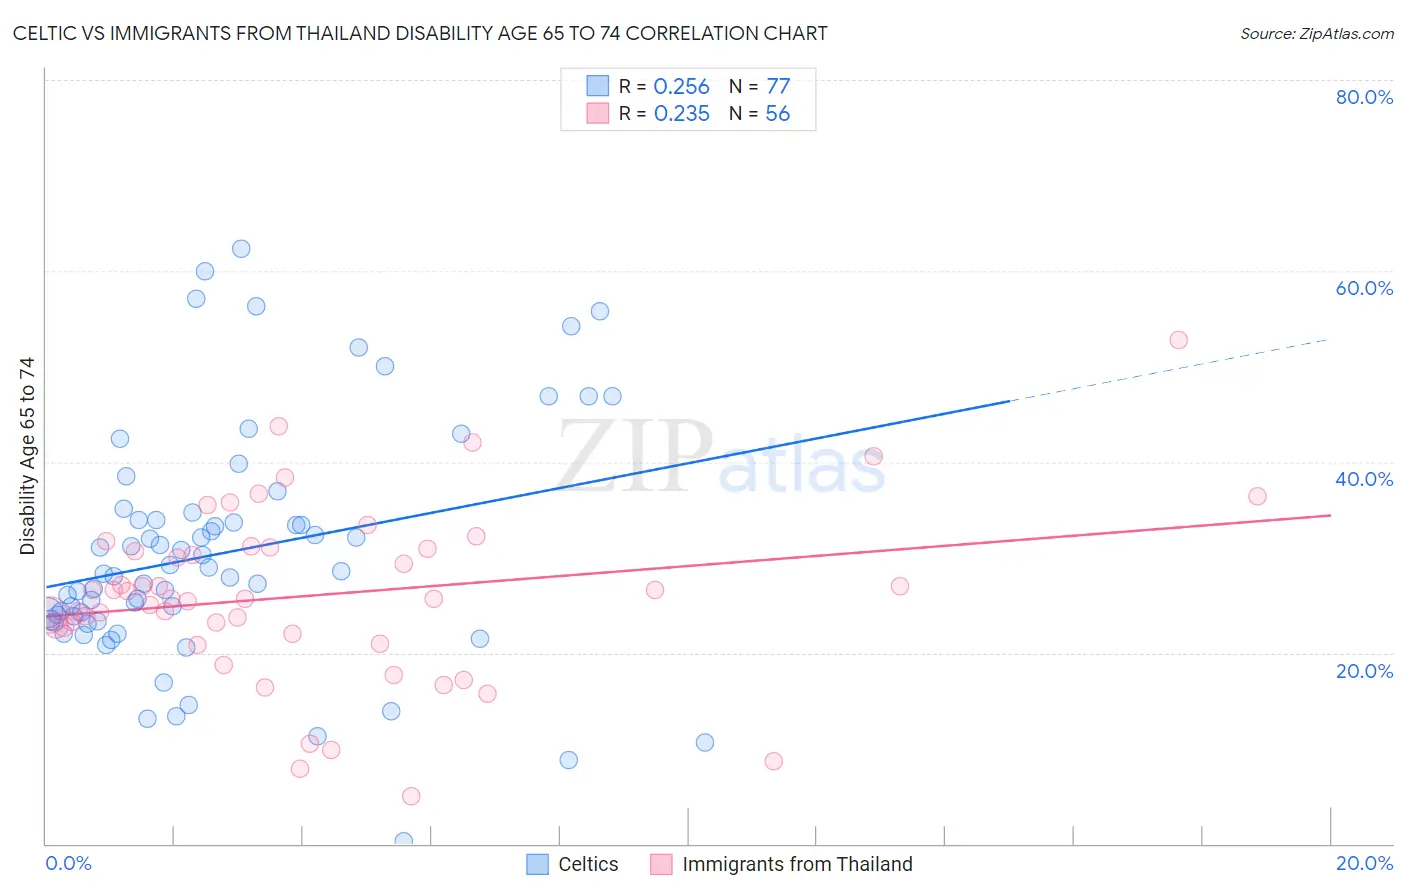
Celtic vs Immigrants from Thailand Disability Age 65 to 74 Correlation Chart
The statistical analysis conducted on geographies consisting of 168,782,457 people shows a weak positive correlation between the proportion of Celtics and percentage of population with a disability between the ages 65 and 75 in the United States with a correlation coefficient (R) of 0.256 and weighted average of 24.2%. Similarly, the statistical analysis conducted on geographies consisting of 316,664,344 people shows a weak positive correlation between the proportion of Immigrants from Thailand and percentage of population with a disability between the ages 65 and 75 in the United States with a correlation coefficient (R) of 0.235 and weighted average of 24.3%, a difference of 0.31%.
Disability Age 65 to 74 Correlation Summary
| Measurement | Celtic | Immigrants from Thailand |
| Minimum | 0.28% | 5.0% |
| Maximum | 62.4% | 52.8% |
| Range | 62.1% | 47.8% |
| Mean | 30.4% | 26.0% |
| Median | 28.3% | 25.7% |
| Interquartile 25% (IQ1) | 23.4% | 22.4% |
| Interquartile 75% (IQ3) | 34.3% | 31.0% |
| Interquartile Range (IQR) | 11.0% | 8.6% |
| Standard Deviation (Sample) | 12.4% | 9.1% |
| Standard Deviation (Population) | 12.3% | 9.0% |
Demographics Similar to Celtics and Immigrants from Thailand by Disability Age 65 to 74
In terms of disability age 65 to 74, the demographic groups most similar to Celtics are White/Caucasian (24.2%, a difference of 0.050%), Barbadian (24.3%, a difference of 0.11%), Nigerian (24.2%, a difference of 0.29%), Iraqi (24.2%, a difference of 0.36%), and Immigrants from Zaire (24.3%, a difference of 0.36%). Similarly, the demographic groups most similar to Immigrants from Thailand are Immigrants from Zaire (24.3%, a difference of 0.050%), Barbadian (24.3%, a difference of 0.20%), Bahamian (24.4%, a difference of 0.21%), Panamanian (24.4%, a difference of 0.32%), and White/Caucasian (24.2%, a difference of 0.35%).
| Demographics | Rating | Rank | Disability Age 65 to 74 |
| Ghanaians | 10.4 /100 | #220 | Poor 24.1% |
| Immigrants | Nicaragua | 9.8 /100 | #221 | Tragic 24.1% |
| Native Hawaiians | 9.3 /100 | #222 | Tragic 24.1% |
| Immigrants | Middle Africa | 8.9 /100 | #223 | Tragic 24.1% |
| Immigrants | Panama | 8.6 /100 | #224 | Tragic 24.1% |
| Bermudans | 8.2 /100 | #225 | Tragic 24.2% |
| Iraqis | 8.1 /100 | #226 | Tragic 24.2% |
| Nigerians | 7.8 /100 | #227 | Tragic 24.2% |
| Whites/Caucasians | 6.6 /100 | #228 | Tragic 24.2% |
| Celtics | 6.4 /100 | #229 | Tragic 24.2% |
| Barbadians | 6.0 /100 | #230 | Tragic 24.3% |
| Immigrants | Thailand | 5.2 /100 | #231 | Tragic 24.3% |
| Immigrants | Zaire | 5.0 /100 | #232 | Tragic 24.3% |
| Bahamians | 4.5 /100 | #233 | Tragic 24.4% |
| Panamanians | 4.2 /100 | #234 | Tragic 24.4% |
| Scotch-Irish | 3.8 /100 | #235 | Tragic 24.4% |
| German Russians | 3.7 /100 | #236 | Tragic 24.4% |
| West Indians | 3.4 /100 | #237 | Tragic 24.5% |
| Immigrants | Ghana | 3.0 /100 | #238 | Tragic 24.5% |
| Immigrants | Caribbean | 2.6 /100 | #239 | Tragic 24.6% |
| Spaniards | 2.4 /100 | #240 | Tragic 24.6% |