Immigrants from Asia vs Immigrants from Thailand Disability Age 65 to 74
COMPARE
Immigrants from Asia
Immigrants from Thailand
Disability Age 65 to 74
Disability Age 65 to 74 Comparison
Immigrants from Asia
Immigrants from Thailand
21.5%
DISABILITY AGE 65 TO 74
99.5/ 100
METRIC RATING
57th/ 347
METRIC RANK
24.3%
DISABILITY AGE 65 TO 74
5.2/ 100
METRIC RATING
231st/ 347
METRIC RANK
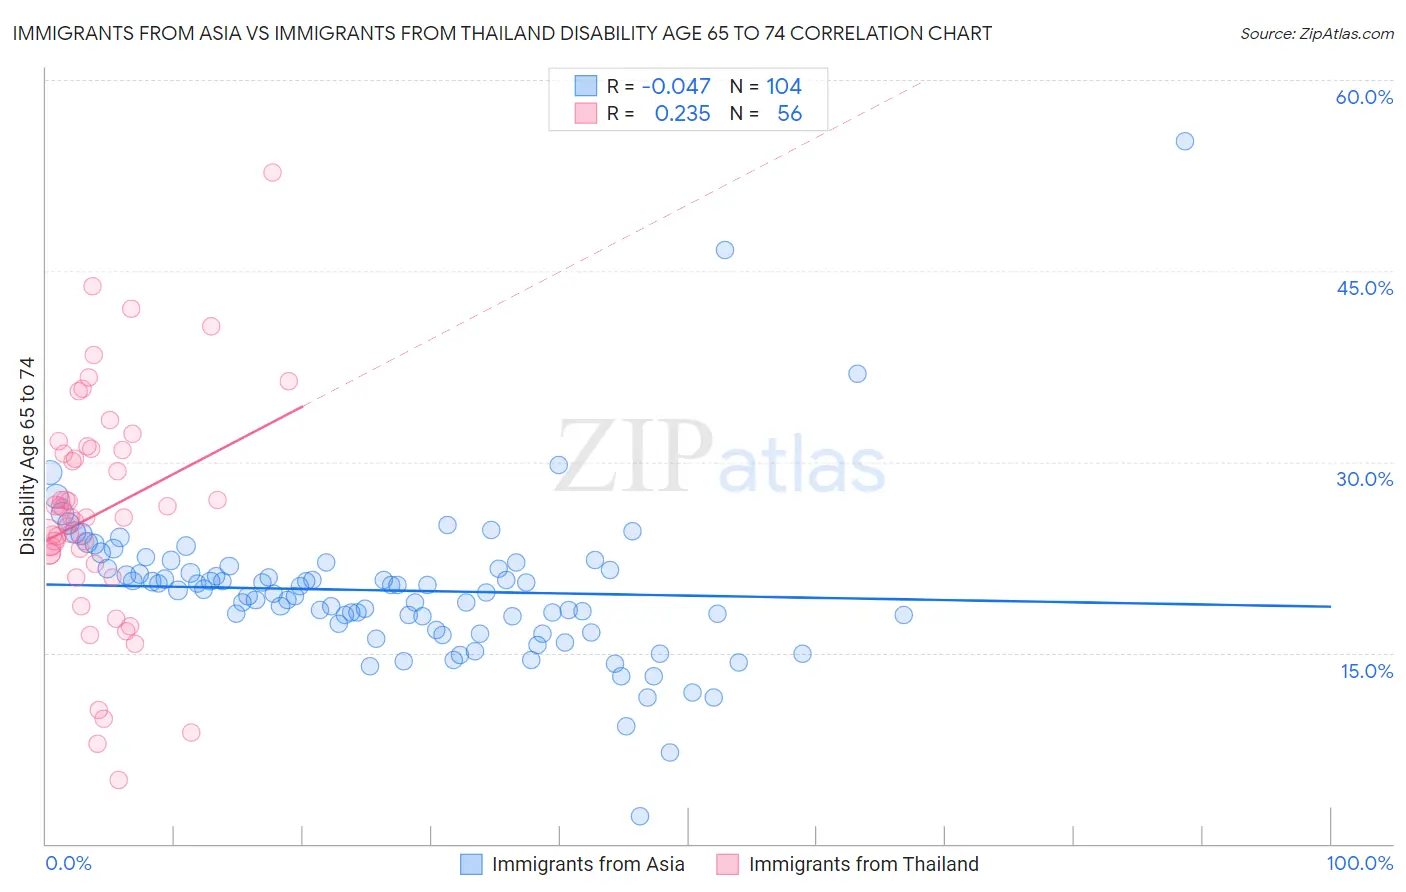
Immigrants from Asia vs Immigrants from Thailand Disability Age 65 to 74 Correlation Chart
The statistical analysis conducted on geographies consisting of 547,092,389 people shows no correlation between the proportion of Immigrants from Asia and percentage of population with a disability between the ages 65 and 75 in the United States with a correlation coefficient (R) of -0.047 and weighted average of 21.5%. Similarly, the statistical analysis conducted on geographies consisting of 316,664,344 people shows a weak positive correlation between the proportion of Immigrants from Thailand and percentage of population with a disability between the ages 65 and 75 in the United States with a correlation coefficient (R) of 0.235 and weighted average of 24.3%, a difference of 12.9%.
Disability Age 65 to 74 Correlation Summary
| Measurement | Immigrants from Asia | Immigrants from Thailand |
| Minimum | 2.2% | 5.0% |
| Maximum | 55.2% | 52.8% |
| Range | 53.1% | 47.8% |
| Mean | 19.9% | 26.0% |
| Median | 19.8% | 25.7% |
| Interquartile 25% (IQ1) | 17.1% | 22.4% |
| Interquartile 75% (IQ3) | 21.6% | 31.0% |
| Interquartile Range (IQR) | 4.6% | 8.6% |
| Standard Deviation (Sample) | 6.3% | 9.1% |
| Standard Deviation (Population) | 6.3% | 9.0% |
Similar Demographics by Disability Age 65 to 74
Demographics Similar to Immigrants from Asia by Disability Age 65 to 74
In terms of disability age 65 to 74, the demographic groups most similar to Immigrants from Asia are Immigrants from Pakistan (21.5%, a difference of 0.030%), Zimbabwean (21.5%, a difference of 0.070%), Immigrants from Denmark (21.5%, a difference of 0.10%), Immigrants from North Macedonia (21.6%, a difference of 0.10%), and Immigrants from Romania (21.5%, a difference of 0.12%).
| Demographics | Rating | Rank | Disability Age 65 to 74 |
| Immigrants | Malaysia | 99.7 /100 | #50 | Exceptional 21.4% |
| Immigrants | Serbia | 99.6 /100 | #51 | Exceptional 21.4% |
| Immigrants | France | 99.6 /100 | #52 | Exceptional 21.5% |
| Bhutanese | 99.6 /100 | #53 | Exceptional 21.5% |
| Immigrants | Italy | 99.6 /100 | #54 | Exceptional 21.5% |
| Immigrants | Romania | 99.5 /100 | #55 | Exceptional 21.5% |
| Immigrants | Denmark | 99.5 /100 | #56 | Exceptional 21.5% |
| Immigrants | Asia | 99.5 /100 | #57 | Exceptional 21.5% |
| Immigrants | Pakistan | 99.5 /100 | #58 | Exceptional 21.5% |
| Zimbabweans | 99.5 /100 | #59 | Exceptional 21.5% |
| Immigrants | North Macedonia | 99.5 /100 | #60 | Exceptional 21.6% |
| Egyptians | 99.5 /100 | #61 | Exceptional 21.6% |
| Carpatho Rusyns | 99.5 /100 | #62 | Exceptional 21.6% |
| Immigrants | Europe | 99.4 /100 | #63 | Exceptional 21.6% |
| Immigrants | Latvia | 99.4 /100 | #64 | Exceptional 21.6% |
Demographics Similar to Immigrants from Thailand by Disability Age 65 to 74
In terms of disability age 65 to 74, the demographic groups most similar to Immigrants from Thailand are Immigrants from Zaire (24.3%, a difference of 0.050%), Barbadian (24.3%, a difference of 0.20%), Bahamian (24.4%, a difference of 0.21%), Celtic (24.2%, a difference of 0.31%), and Panamanian (24.4%, a difference of 0.32%).
| Demographics | Rating | Rank | Disability Age 65 to 74 |
| Immigrants | Panama | 8.6 /100 | #224 | Tragic 24.1% |
| Bermudans | 8.2 /100 | #225 | Tragic 24.2% |
| Iraqis | 8.1 /100 | #226 | Tragic 24.2% |
| Nigerians | 7.8 /100 | #227 | Tragic 24.2% |
| Whites/Caucasians | 6.6 /100 | #228 | Tragic 24.2% |
| Celtics | 6.4 /100 | #229 | Tragic 24.2% |
| Barbadians | 6.0 /100 | #230 | Tragic 24.3% |
| Immigrants | Thailand | 5.2 /100 | #231 | Tragic 24.3% |
| Immigrants | Zaire | 5.0 /100 | #232 | Tragic 24.3% |
| Bahamians | 4.5 /100 | #233 | Tragic 24.4% |
| Panamanians | 4.2 /100 | #234 | Tragic 24.4% |
| Scotch-Irish | 3.8 /100 | #235 | Tragic 24.4% |
| German Russians | 3.7 /100 | #236 | Tragic 24.4% |
| West Indians | 3.4 /100 | #237 | Tragic 24.5% |
| Immigrants | Ghana | 3.0 /100 | #238 | Tragic 24.5% |