Celtic vs Immigrants from Thailand Per Capita Income
COMPARE
Celtic
Immigrants from Thailand
Per Capita Income
Per Capita Income Comparison
Celtics
Immigrants from Thailand
$43,621
PER CAPITA INCOME
48.9/ 100
METRIC RATING
175th/ 347
METRIC RANK
$42,289
PER CAPITA INCOME
17.6/ 100
METRIC RATING
201st/ 347
METRIC RANK
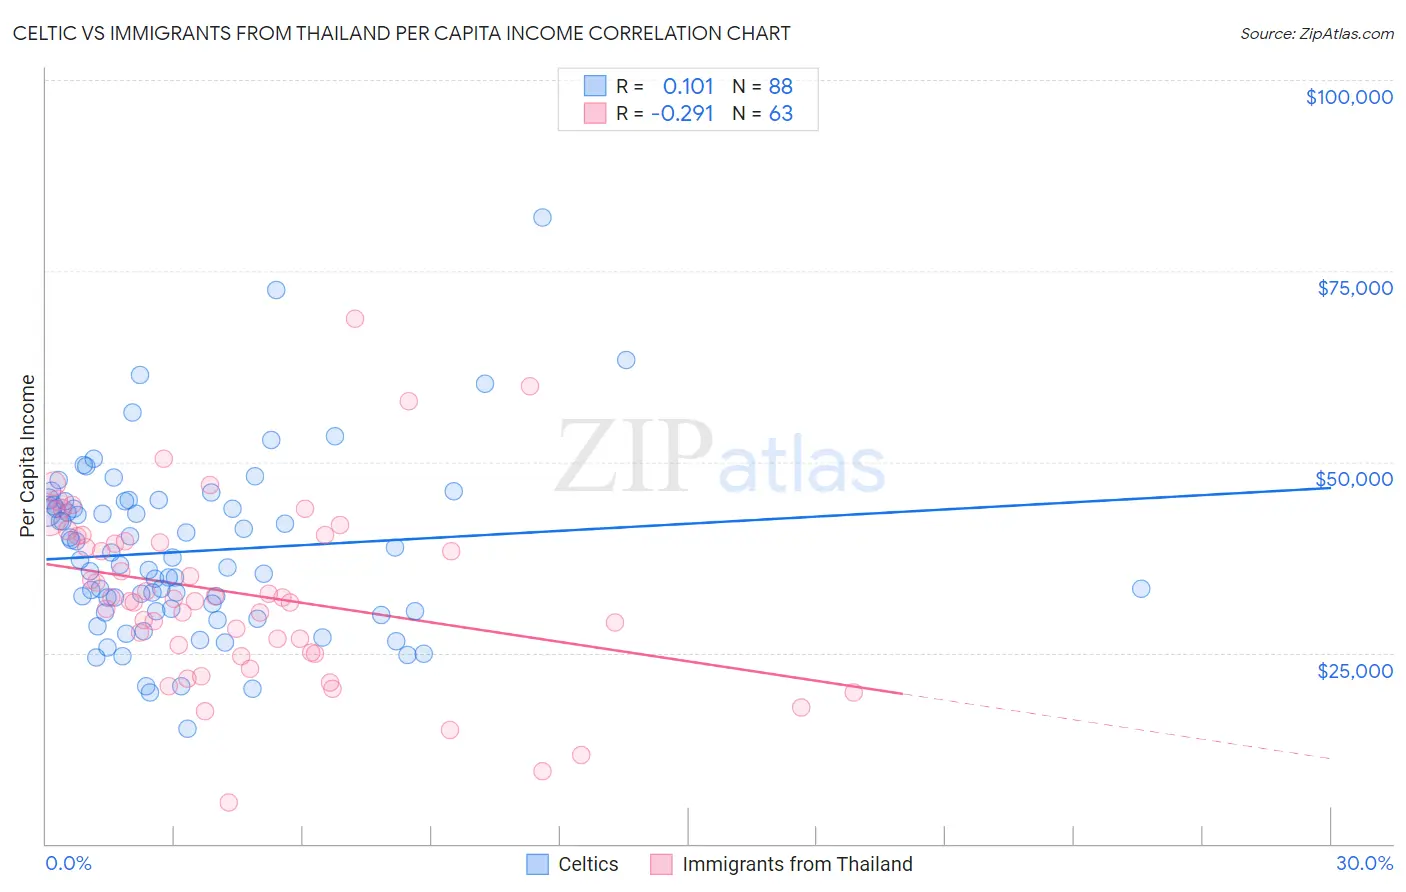
Celtic vs Immigrants from Thailand Per Capita Income Correlation Chart
The statistical analysis conducted on geographies consisting of 168,877,272 people shows a poor positive correlation between the proportion of Celtics and per capita income in the United States with a correlation coefficient (R) of 0.101 and weighted average of $43,621. Similarly, the statistical analysis conducted on geographies consisting of 317,026,349 people shows a weak negative correlation between the proportion of Immigrants from Thailand and per capita income in the United States with a correlation coefficient (R) of -0.291 and weighted average of $42,289, a difference of 3.2%.
Per Capita Income Correlation Summary
| Measurement | Celtic | Immigrants from Thailand |
| Minimum | $15,033 | $5,324 |
| Maximum | $81,943 | $68,712 |
| Range | $66,910 | $63,388 |
| Mean | $38,287 | $32,742 |
| Median | $36,864 | $32,020 |
| Interquartile 25% (IQ1) | $30,511 | $24,989 |
| Interquartile 75% (IQ3) | $44,540 | $40,306 |
| Interquartile Range (IQR) | $14,029 | $15,317 |
| Standard Deviation (Sample) | $11,448 | $11,676 |
| Standard Deviation (Population) | $11,383 | $11,583 |
Similar Demographics by Per Capita Income
Demographics Similar to Celtics by Per Capita Income
In terms of per capita income, the demographic groups most similar to Celtics are Colombian ($43,661, a difference of 0.090%), French ($43,685, a difference of 0.15%), Immigrants from South Eastern Asia ($43,539, a difference of 0.19%), Tlingit-Haida ($43,516, a difference of 0.24%), and Immigrants from Costa Rica ($43,464, a difference of 0.36%).
| Demographics | Rating | Rank | Per Capita Income |
| Belgians | 58.1 /100 | #168 | Average $43,951 |
| Immigrants | Peru | 55.3 /100 | #169 | Average $43,852 |
| Scandinavians | 55.2 /100 | #170 | Average $43,848 |
| Immigrants | Eastern Africa | 54.9 /100 | #171 | Average $43,838 |
| Czechoslovakians | 54.1 /100 | #172 | Average $43,806 |
| French | 50.7 /100 | #173 | Average $43,685 |
| Colombians | 50.0 /100 | #174 | Average $43,661 |
| Celtics | 48.9 /100 | #175 | Average $43,621 |
| Immigrants | South Eastern Asia | 46.6 /100 | #176 | Average $43,539 |
| Tlingit-Haida | 45.9 /100 | #177 | Average $43,516 |
| Immigrants | Costa Rica | 44.5 /100 | #178 | Average $43,464 |
| Finns | 44.4 /100 | #179 | Average $43,461 |
| Sierra Leoneans | 42.9 /100 | #180 | Average $43,405 |
| Welsh | 38.2 /100 | #181 | Fair $43,233 |
| Immigrants | Vietnam | 38.1 /100 | #182 | Fair $43,229 |
Demographics Similar to Immigrants from Thailand by Per Capita Income
In terms of per capita income, the demographic groups most similar to Immigrants from Thailand are Immigrants from Bosnia and Herzegovina ($42,278, a difference of 0.030%), Spanish ($42,249, a difference of 0.090%), Vietnamese ($42,368, a difference of 0.19%), Aleut ($42,210, a difference of 0.19%), and White/Caucasian ($42,180, a difference of 0.26%).
| Demographics | Rating | Rank | Per Capita Income |
| Immigrants | Fiji | 25.2 /100 | #194 | Fair $42,694 |
| Immigrants | Kenya | 24.5 /100 | #195 | Fair $42,661 |
| Dutch | 23.4 /100 | #196 | Fair $42,605 |
| Scotch-Irish | 22.6 /100 | #197 | Fair $42,563 |
| Immigrants | Portugal | 19.7 /100 | #198 | Poor $42,412 |
| Barbadians | 19.6 /100 | #199 | Poor $42,406 |
| Vietnamese | 19.0 /100 | #200 | Poor $42,368 |
| Immigrants | Thailand | 17.6 /100 | #201 | Poor $42,289 |
| Immigrants | Bosnia and Herzegovina | 17.5 /100 | #202 | Poor $42,278 |
| Spanish | 17.0 /100 | #203 | Poor $42,249 |
| Aleuts | 16.4 /100 | #204 | Poor $42,210 |
| Whites/Caucasians | 15.9 /100 | #205 | Poor $42,180 |
| Ghanaians | 15.7 /100 | #206 | Poor $42,164 |
| Venezuelans | 14.4 /100 | #207 | Poor $42,074 |
| Panamanians | 13.9 /100 | #208 | Poor $42,035 |