U.S. Virgin Islander vs Immigrants from Thailand Disability Age 65 to 74
COMPARE
U.S. Virgin Islander
Immigrants from Thailand
Disability Age 65 to 74
Disability Age 65 to 74 Comparison
U.S. Virgin Islanders
Immigrants from Thailand
25.9%
DISABILITY AGE 65 TO 74
0.1/ 100
METRIC RATING
279th/ 347
METRIC RANK
24.3%
DISABILITY AGE 65 TO 74
5.2/ 100
METRIC RATING
231st/ 347
METRIC RANK
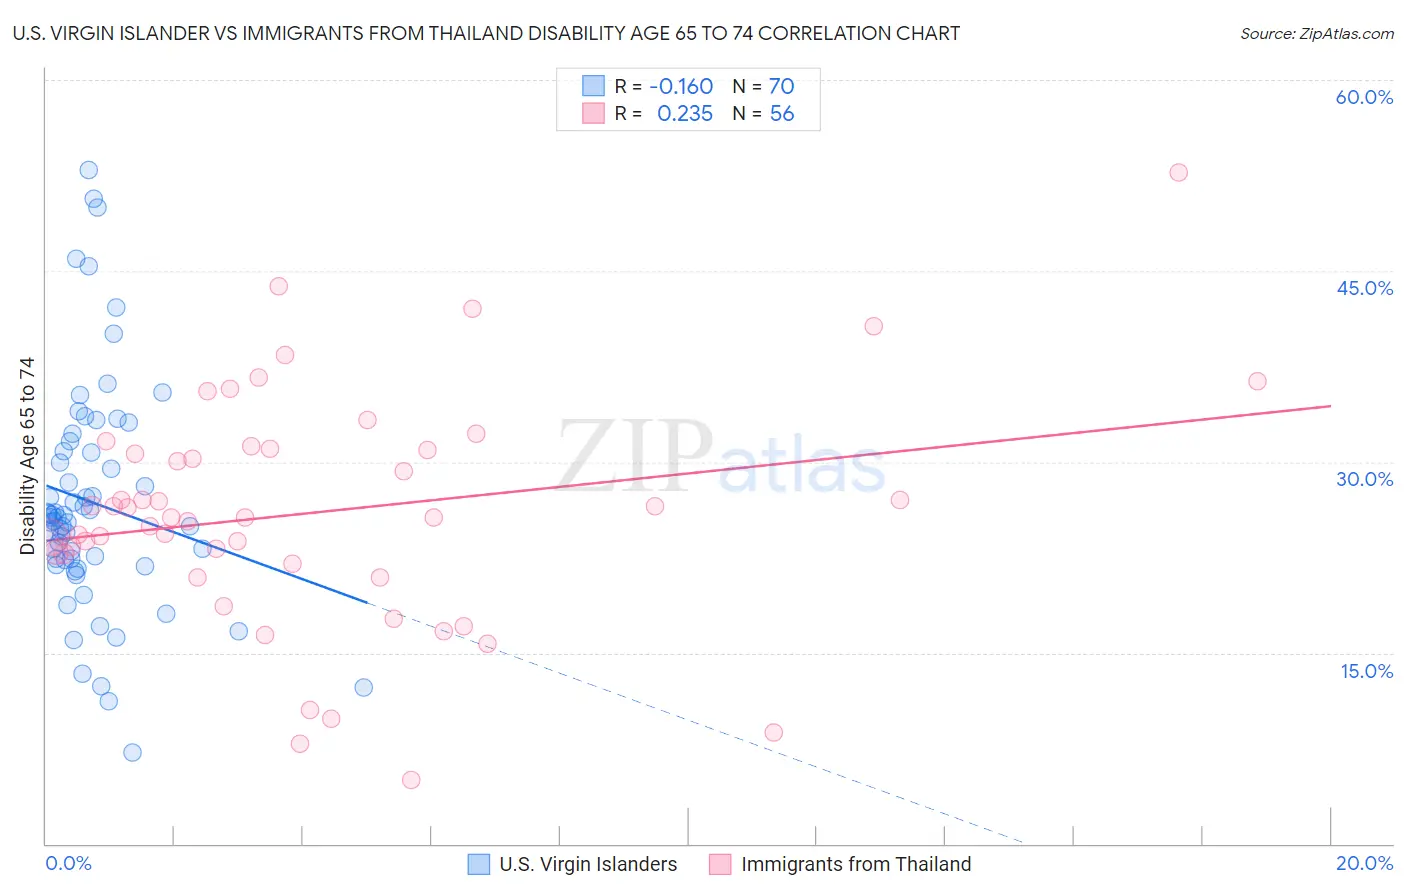
U.S. Virgin Islander vs Immigrants from Thailand Disability Age 65 to 74 Correlation Chart
The statistical analysis conducted on geographies consisting of 87,465,301 people shows a poor negative correlation between the proportion of U.S. Virgin Islanders and percentage of population with a disability between the ages 65 and 75 in the United States with a correlation coefficient (R) of -0.160 and weighted average of 25.9%. Similarly, the statistical analysis conducted on geographies consisting of 316,664,344 people shows a weak positive correlation between the proportion of Immigrants from Thailand and percentage of population with a disability between the ages 65 and 75 in the United States with a correlation coefficient (R) of 0.235 and weighted average of 24.3%, a difference of 6.3%.
Disability Age 65 to 74 Correlation Summary
| Measurement | U.S. Virgin Islander | Immigrants from Thailand |
| Minimum | 7.1% | 5.0% |
| Maximum | 52.9% | 52.8% |
| Range | 45.8% | 47.8% |
| Mean | 26.8% | 26.0% |
| Median | 25.6% | 25.7% |
| Interquartile 25% (IQ1) | 22.3% | 22.4% |
| Interquartile 75% (IQ3) | 30.9% | 31.0% |
| Interquartile Range (IQR) | 8.6% | 8.6% |
| Standard Deviation (Sample) | 9.0% | 9.1% |
| Standard Deviation (Population) | 9.0% | 9.0% |
Similar Demographics by Disability Age 65 to 74
Demographics Similar to U.S. Virgin Islanders by Disability Age 65 to 74
In terms of disability age 65 to 74, the demographic groups most similar to U.S. Virgin Islanders are Immigrants from Belize (25.8%, a difference of 0.080%), Cree (25.9%, a difference of 0.080%), Belizean (25.8%, a difference of 0.10%), Immigrants from Honduras (25.9%, a difference of 0.10%), and Delaware (25.9%, a difference of 0.18%).
| Demographics | Rating | Rank | Disability Age 65 to 74 |
| Immigrants | Dominica | 0.1 /100 | #272 | Tragic 25.7% |
| Japanese | 0.1 /100 | #273 | Tragic 25.7% |
| Americans | 0.1 /100 | #274 | Tragic 25.8% |
| Hondurans | 0.1 /100 | #275 | Tragic 25.8% |
| French American Indians | 0.1 /100 | #276 | Tragic 25.8% |
| Belizeans | 0.1 /100 | #277 | Tragic 25.8% |
| Immigrants | Belize | 0.1 /100 | #278 | Tragic 25.8% |
| U.S. Virgin Islanders | 0.1 /100 | #279 | Tragic 25.9% |
| Cree | 0.1 /100 | #280 | Tragic 25.9% |
| Immigrants | Honduras | 0.1 /100 | #281 | Tragic 25.9% |
| Delaware | 0.1 /100 | #282 | Tragic 25.9% |
| Spanish Americans | 0.0 /100 | #283 | Tragic 25.9% |
| Immigrants | Azores | 0.0 /100 | #284 | Tragic 26.0% |
| Immigrants | Congo | 0.0 /100 | #285 | Tragic 26.0% |
| Immigrants | Micronesia | 0.0 /100 | #286 | Tragic 26.1% |
Demographics Similar to Immigrants from Thailand by Disability Age 65 to 74
In terms of disability age 65 to 74, the demographic groups most similar to Immigrants from Thailand are Immigrants from Zaire (24.3%, a difference of 0.050%), Barbadian (24.3%, a difference of 0.20%), Bahamian (24.4%, a difference of 0.21%), Celtic (24.2%, a difference of 0.31%), and Panamanian (24.4%, a difference of 0.32%).
| Demographics | Rating | Rank | Disability Age 65 to 74 |
| Immigrants | Panama | 8.6 /100 | #224 | Tragic 24.1% |
| Bermudans | 8.2 /100 | #225 | Tragic 24.2% |
| Iraqis | 8.1 /100 | #226 | Tragic 24.2% |
| Nigerians | 7.8 /100 | #227 | Tragic 24.2% |
| Whites/Caucasians | 6.6 /100 | #228 | Tragic 24.2% |
| Celtics | 6.4 /100 | #229 | Tragic 24.2% |
| Barbadians | 6.0 /100 | #230 | Tragic 24.3% |
| Immigrants | Thailand | 5.2 /100 | #231 | Tragic 24.3% |
| Immigrants | Zaire | 5.0 /100 | #232 | Tragic 24.3% |
| Bahamians | 4.5 /100 | #233 | Tragic 24.4% |
| Panamanians | 4.2 /100 | #234 | Tragic 24.4% |
| Scotch-Irish | 3.8 /100 | #235 | Tragic 24.4% |
| German Russians | 3.7 /100 | #236 | Tragic 24.4% |
| West Indians | 3.4 /100 | #237 | Tragic 24.5% |
| Immigrants | Ghana | 3.0 /100 | #238 | Tragic 24.5% |