Celtic vs Iraqi Disability Age 65 to 74
COMPARE
Celtic
Iraqi
Disability Age 65 to 74
Disability Age 65 to 74 Comparison
Celtics
Iraqis
24.2%
DISABILITY AGE 65 TO 74
6.4/ 100
METRIC RATING
229th/ 347
METRIC RANK
24.2%
DISABILITY AGE 65 TO 74
8.1/ 100
METRIC RATING
226th/ 347
METRIC RANK
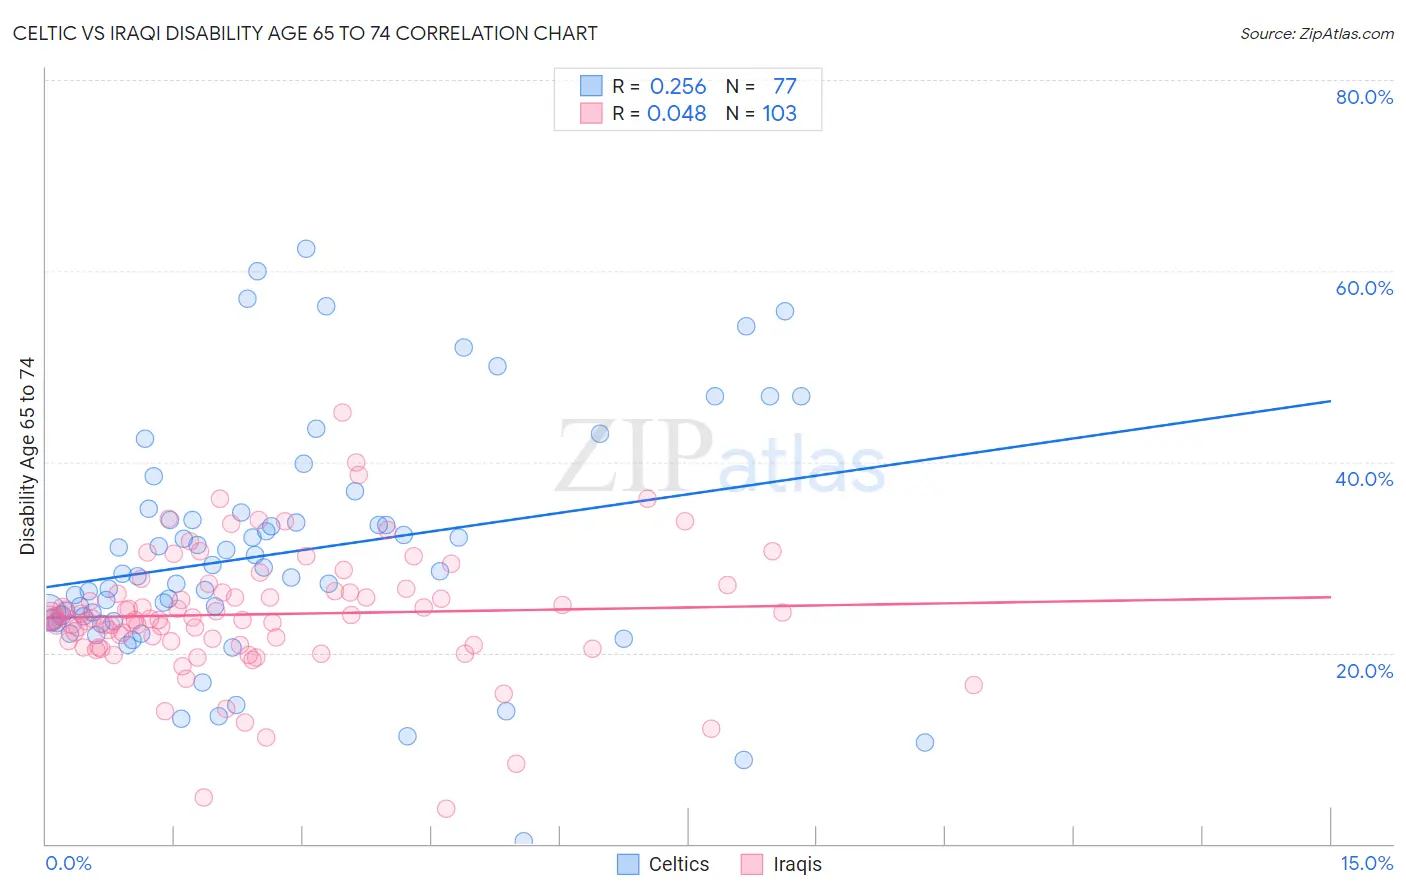
Celtic vs Iraqi Disability Age 65 to 74 Correlation Chart
The statistical analysis conducted on geographies consisting of 168,782,457 people shows a weak positive correlation between the proportion of Celtics and percentage of population with a disability between the ages 65 and 75 in the United States with a correlation coefficient (R) of 0.256 and weighted average of 24.2%. Similarly, the statistical analysis conducted on geographies consisting of 170,539,860 people shows no correlation between the proportion of Iraqis and percentage of population with a disability between the ages 65 and 75 in the United States with a correlation coefficient (R) of 0.048 and weighted average of 24.2%, a difference of 0.36%.
Disability Age 65 to 74 Correlation Summary
| Measurement | Celtic | Iraqi |
| Minimum | 0.28% | 3.6% |
| Maximum | 62.4% | 45.1% |
| Range | 62.1% | 41.5% |
| Mean | 30.4% | 24.0% |
| Median | 28.3% | 23.6% |
| Interquartile 25% (IQ1) | 23.4% | 20.8% |
| Interquartile 75% (IQ3) | 34.3% | 26.5% |
| Interquartile Range (IQR) | 11.0% | 5.6% |
| Standard Deviation (Sample) | 12.4% | 6.5% |
| Standard Deviation (Population) | 12.3% | 6.5% |
Demographics Similar to Celtics and Iraqis by Disability Age 65 to 74
In terms of disability age 65 to 74, the demographic groups most similar to Celtics are White/Caucasian (24.2%, a difference of 0.050%), Barbadian (24.3%, a difference of 0.11%), Nigerian (24.2%, a difference of 0.29%), Immigrants from Thailand (24.3%, a difference of 0.31%), and Immigrants from Zaire (24.3%, a difference of 0.36%). Similarly, the demographic groups most similar to Iraqis are Bermudan (24.2%, a difference of 0.010%), Nigerian (24.2%, a difference of 0.070%), Immigrants from Panama (24.1%, a difference of 0.090%), Immigrants from Middle Africa (24.1%, a difference of 0.14%), and Native Hawaiian (24.1%, a difference of 0.21%).
| Demographics | Rating | Rank | Disability Age 65 to 74 |
| Immigrants | Portugal | 11.7 /100 | #217 | Poor 24.0% |
| Immigrants | Nigeria | 11.7 /100 | #218 | Poor 24.0% |
| Immigrants | Burma/Myanmar | 11.6 /100 | #219 | Poor 24.0% |
| Ghanaians | 10.4 /100 | #220 | Poor 24.1% |
| Immigrants | Nicaragua | 9.8 /100 | #221 | Tragic 24.1% |
| Native Hawaiians | 9.3 /100 | #222 | Tragic 24.1% |
| Immigrants | Middle Africa | 8.9 /100 | #223 | Tragic 24.1% |
| Immigrants | Panama | 8.6 /100 | #224 | Tragic 24.1% |
| Bermudans | 8.2 /100 | #225 | Tragic 24.2% |
| Iraqis | 8.1 /100 | #226 | Tragic 24.2% |
| Nigerians | 7.8 /100 | #227 | Tragic 24.2% |
| Whites/Caucasians | 6.6 /100 | #228 | Tragic 24.2% |
| Celtics | 6.4 /100 | #229 | Tragic 24.2% |
| Barbadians | 6.0 /100 | #230 | Tragic 24.3% |
| Immigrants | Thailand | 5.2 /100 | #231 | Tragic 24.3% |
| Immigrants | Zaire | 5.0 /100 | #232 | Tragic 24.3% |
| Bahamians | 4.5 /100 | #233 | Tragic 24.4% |
| Panamanians | 4.2 /100 | #234 | Tragic 24.4% |
| Scotch-Irish | 3.8 /100 | #235 | Tragic 24.4% |
| German Russians | 3.7 /100 | #236 | Tragic 24.4% |
| West Indians | 3.4 /100 | #237 | Tragic 24.5% |