Celtic vs Immigrants from Thailand 1 or more Vehicles in Household
COMPARE
Celtic
Immigrants from Thailand
1 or more Vehicles in Household
1 or more Vehicles in Household Comparison
Celtics
Immigrants from Thailand
92.1%
1 OR MORE VEHICLES IN HOUSEHOLD
99.9/ 100
METRIC RATING
51st/ 347
METRIC RANK
90.6%
1 OR MORE VEHICLES IN HOUSEHOLD
92.3/ 100
METRIC RATING
120th/ 347
METRIC RANK
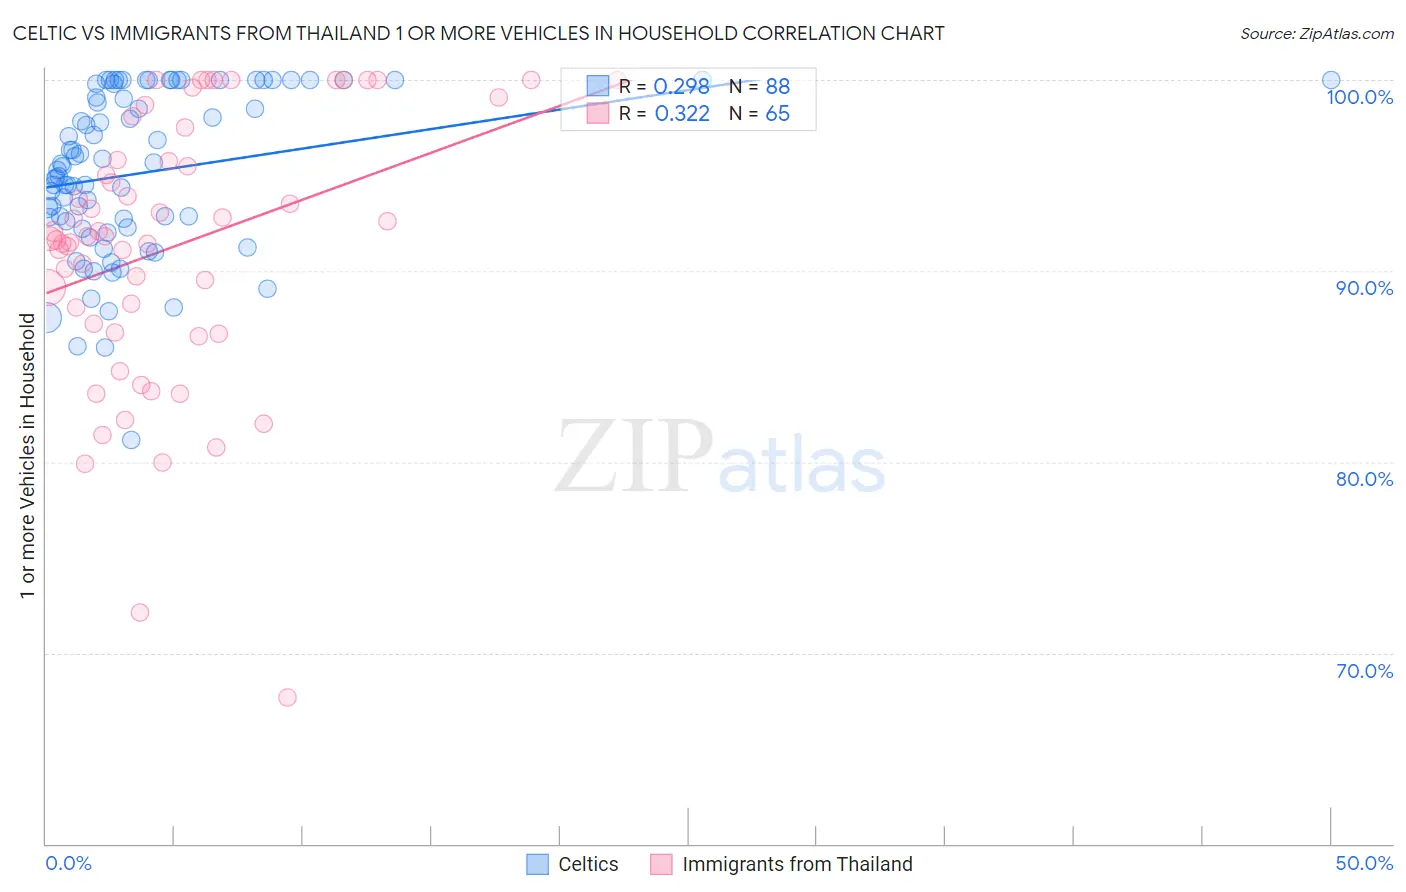
Celtic vs Immigrants from Thailand 1 or more Vehicles in Household Correlation Chart
The statistical analysis conducted on geographies consisting of 168,861,273 people shows a weak positive correlation between the proportion of Celtics and percentage of households with 1 or more vehicles available in the United States with a correlation coefficient (R) of 0.298 and weighted average of 92.1%. Similarly, the statistical analysis conducted on geographies consisting of 316,939,946 people shows a mild positive correlation between the proportion of Immigrants from Thailand and percentage of households with 1 or more vehicles available in the United States with a correlation coefficient (R) of 0.322 and weighted average of 90.6%, a difference of 1.7%.
1 or more Vehicles in Household Correlation Summary
| Measurement | Celtic | Immigrants from Thailand |
| Minimum | 81.1% | 67.6% |
| Maximum | 100.0% | 100.0% |
| Range | 18.9% | 32.4% |
| Mean | 95.2% | 91.3% |
| Median | 95.4% | 91.8% |
| Interquartile 25% (IQ1) | 92.4% | 87.0% |
| Interquartile 75% (IQ3) | 99.8% | 96.7% |
| Interquartile Range (IQR) | 7.4% | 9.6% |
| Standard Deviation (Sample) | 4.2% | 7.0% |
| Standard Deviation (Population) | 4.2% | 7.0% |
Similar Demographics by 1 or more Vehicles in Household
Demographics Similar to Celtics by 1 or more Vehicles in Household
In terms of 1 or more vehicles in household, the demographic groups most similar to Celtics are Guamanian/Chamorro (92.1%, a difference of 0.010%), Afghan (92.1%, a difference of 0.020%), Belgian (92.1%, a difference of 0.030%), Korean (92.1%, a difference of 0.030%), and Hawaiian (92.0%, a difference of 0.060%).
| Demographics | Rating | Rank | 1 or more Vehicles in Household |
| Choctaw | 99.9 /100 | #44 | Exceptional 92.2% |
| Immigrants | Nonimmigrants | 99.9 /100 | #45 | Exceptional 92.2% |
| Immigrants | Fiji | 99.9 /100 | #46 | Exceptional 92.2% |
| Northern Europeans | 99.9 /100 | #47 | Exceptional 92.2% |
| Belgians | 99.9 /100 | #48 | Exceptional 92.1% |
| Afghans | 99.9 /100 | #49 | Exceptional 92.1% |
| Guamanians/Chamorros | 99.9 /100 | #50 | Exceptional 92.1% |
| Celtics | 99.9 /100 | #51 | Exceptional 92.1% |
| Koreans | 99.9 /100 | #52 | Exceptional 92.1% |
| Hawaiians | 99.9 /100 | #53 | Exceptional 92.0% |
| Slovenes | 99.9 /100 | #54 | Exceptional 92.0% |
| Immigrants | Afghanistan | 99.9 /100 | #55 | Exceptional 92.0% |
| Immigrants | Venezuela | 99.9 /100 | #56 | Exceptional 92.0% |
| Iraqis | 99.8 /100 | #57 | Exceptional 91.9% |
| Immigrants | Mexico | 99.8 /100 | #58 | Exceptional 91.9% |
Demographics Similar to Immigrants from Thailand by 1 or more Vehicles in Household
In terms of 1 or more vehicles in household, the demographic groups most similar to Immigrants from Thailand are Icelander (90.5%, a difference of 0.010%), Blackfeet (90.6%, a difference of 0.020%), Costa Rican (90.5%, a difference of 0.020%), Fijian (90.5%, a difference of 0.020%), and Puget Sound Salish (90.5%, a difference of 0.040%).
| Demographics | Rating | Rank | 1 or more Vehicles in Household |
| Immigrants | Kuwait | 94.7 /100 | #113 | Exceptional 90.7% |
| Armenians | 94.5 /100 | #114 | Exceptional 90.7% |
| Serbians | 94.3 /100 | #115 | Exceptional 90.7% |
| Chippewa | 94.3 /100 | #116 | Exceptional 90.7% |
| Greeks | 93.5 /100 | #117 | Exceptional 90.6% |
| Japanese | 93.4 /100 | #118 | Exceptional 90.6% |
| Blackfeet | 92.6 /100 | #119 | Exceptional 90.6% |
| Immigrants | Thailand | 92.3 /100 | #120 | Exceptional 90.6% |
| Icelanders | 92.1 /100 | #121 | Exceptional 90.5% |
| Costa Ricans | 92.0 /100 | #122 | Exceptional 90.5% |
| Fijians | 91.8 /100 | #123 | Exceptional 90.5% |
| Puget Sound Salish | 91.5 /100 | #124 | Exceptional 90.5% |
| Immigrants | Korea | 90.5 /100 | #125 | Exceptional 90.5% |
| Immigrants | Cameroon | 89.4 /100 | #126 | Excellent 90.4% |
| Immigrants | Azores | 89.1 /100 | #127 | Excellent 90.4% |