Northern European vs Immigrants from Thailand Disability Age 65 to 74
COMPARE
Northern European
Immigrants from Thailand
Disability Age 65 to 74
Disability Age 65 to 74 Comparison
Northern Europeans
Immigrants from Thailand
22.6%
DISABILITY AGE 65 TO 74
88.9/ 100
METRIC RATING
133rd/ 347
METRIC RANK
24.3%
DISABILITY AGE 65 TO 74
5.2/ 100
METRIC RATING
231st/ 347
METRIC RANK
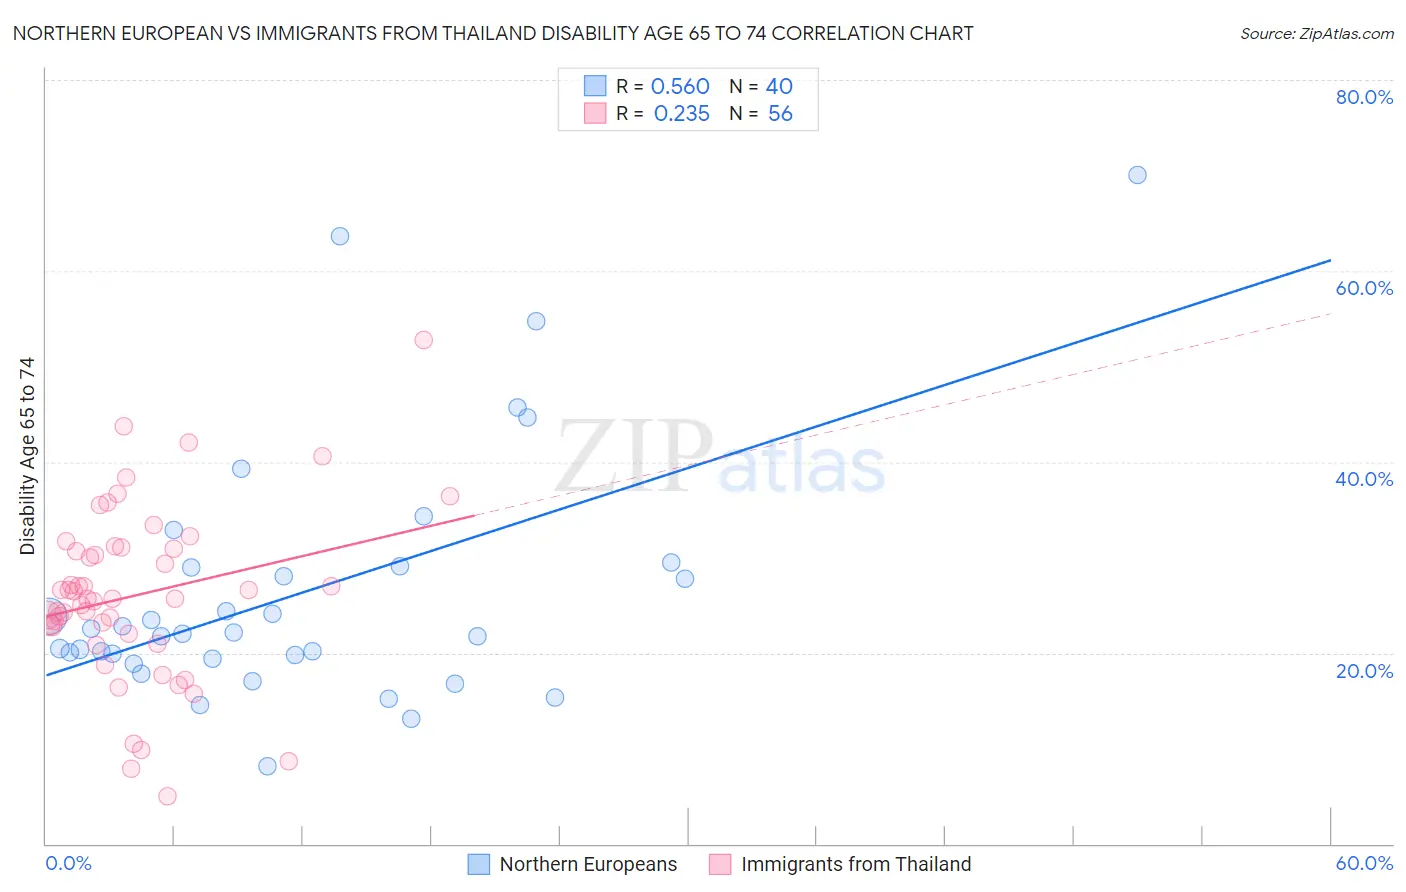
Northern European vs Immigrants from Thailand Disability Age 65 to 74 Correlation Chart
The statistical analysis conducted on geographies consisting of 405,506,893 people shows a substantial positive correlation between the proportion of Northern Europeans and percentage of population with a disability between the ages 65 and 75 in the United States with a correlation coefficient (R) of 0.560 and weighted average of 22.6%. Similarly, the statistical analysis conducted on geographies consisting of 316,664,344 people shows a weak positive correlation between the proportion of Immigrants from Thailand and percentage of population with a disability between the ages 65 and 75 in the United States with a correlation coefficient (R) of 0.235 and weighted average of 24.3%, a difference of 7.5%.
Disability Age 65 to 74 Correlation Summary
| Measurement | Northern European | Immigrants from Thailand |
| Minimum | 8.1% | 5.0% |
| Maximum | 70.0% | 52.8% |
| Range | 61.9% | 47.8% |
| Mean | 26.3% | 26.0% |
| Median | 22.0% | 25.7% |
| Interquartile 25% (IQ1) | 19.6% | 22.4% |
| Interquartile 75% (IQ3) | 29.0% | 31.0% |
| Interquartile Range (IQR) | 9.4% | 8.6% |
| Standard Deviation (Sample) | 13.2% | 9.1% |
| Standard Deviation (Population) | 13.0% | 9.0% |
Similar Demographics by Disability Age 65 to 74
Demographics Similar to Northern Europeans by Disability Age 65 to 74
In terms of disability age 65 to 74, the demographic groups most similar to Northern Europeans are Costa Rican (22.6%, a difference of 0.050%), Afghan (22.6%, a difference of 0.050%), Immigrants from Nepal (22.6%, a difference of 0.080%), Immigrants from Ukraine (22.6%, a difference of 0.080%), and Ethiopian (22.7%, a difference of 0.15%).
| Demographics | Rating | Rank | Disability Age 65 to 74 |
| Lebanese | 92.2 /100 | #126 | Exceptional 22.5% |
| Slovaks | 91.6 /100 | #127 | Exceptional 22.5% |
| Immigrants | Costa Rica | 90.4 /100 | #128 | Exceptional 22.6% |
| Immigrants | Uruguay | 90.1 /100 | #129 | Exceptional 22.6% |
| Immigrants | Albania | 90.0 /100 | #130 | Excellent 22.6% |
| Immigrants | Nepal | 89.4 /100 | #131 | Excellent 22.6% |
| Costa Ricans | 89.2 /100 | #132 | Excellent 22.6% |
| Northern Europeans | 88.9 /100 | #133 | Excellent 22.6% |
| Afghans | 88.6 /100 | #134 | Excellent 22.6% |
| Immigrants | Ukraine | 88.4 /100 | #135 | Excellent 22.6% |
| Ethiopians | 87.9 /100 | #136 | Excellent 22.7% |
| Taiwanese | 87.6 /100 | #137 | Excellent 22.7% |
| Immigrants | Moldova | 87.3 /100 | #138 | Excellent 22.7% |
| Immigrants | Syria | 85.8 /100 | #139 | Excellent 22.7% |
| Ugandans | 85.4 /100 | #140 | Excellent 22.7% |
Demographics Similar to Immigrants from Thailand by Disability Age 65 to 74
In terms of disability age 65 to 74, the demographic groups most similar to Immigrants from Thailand are Immigrants from Zaire (24.3%, a difference of 0.050%), Barbadian (24.3%, a difference of 0.20%), Bahamian (24.4%, a difference of 0.21%), Celtic (24.2%, a difference of 0.31%), and Panamanian (24.4%, a difference of 0.32%).
| Demographics | Rating | Rank | Disability Age 65 to 74 |
| Immigrants | Panama | 8.6 /100 | #224 | Tragic 24.1% |
| Bermudans | 8.2 /100 | #225 | Tragic 24.2% |
| Iraqis | 8.1 /100 | #226 | Tragic 24.2% |
| Nigerians | 7.8 /100 | #227 | Tragic 24.2% |
| Whites/Caucasians | 6.6 /100 | #228 | Tragic 24.2% |
| Celtics | 6.4 /100 | #229 | Tragic 24.2% |
| Barbadians | 6.0 /100 | #230 | Tragic 24.3% |
| Immigrants | Thailand | 5.2 /100 | #231 | Tragic 24.3% |
| Immigrants | Zaire | 5.0 /100 | #232 | Tragic 24.3% |
| Bahamians | 4.5 /100 | #233 | Tragic 24.4% |
| Panamanians | 4.2 /100 | #234 | Tragic 24.4% |
| Scotch-Irish | 3.8 /100 | #235 | Tragic 24.4% |
| German Russians | 3.7 /100 | #236 | Tragic 24.4% |
| West Indians | 3.4 /100 | #237 | Tragic 24.5% |
| Immigrants | Ghana | 3.0 /100 | #238 | Tragic 24.5% |