Immigrants from Greece vs Immigrants from Thailand Disability Age 65 to 74

COMPARE

Immigrants from Greece
Race
Ancestry
AfghanAfricanAlaska NativeAlaskan AthabascanAlbanianAleutAlsatianAmericanApacheArabArapahoArgentineanArmenianAssyrian/Chaldean/SyriacAustralianAustrianBahamianBangladeshiBarbadianBasqueBelgianBelizeanBermudanBhutaneseBlackfeetBolivianBrazilianBritishBritish West IndianBulgarianBurmeseCajunCambodianCanadianCape VerdeanCarpatho RusynCelticCentral AmericanCentral American IndianCherokeeCheyenneChickasawChileanChineseChippewaChoctawColombianColvilleComancheCosta RicanCreeCreekCroatianCrowCubanCypriotCzechCzechoslovakianDanishDelawareDominicanDutchDutch West IndianEastern EuropeanEcuadorianEgyptianEnglishEstonianEthiopianEuropeanFijianFilipinoFinnishFrenchFrench American IndianFrench CanadianGermanGerman RussianGhanaianGreekGuamanian/ChamorroGuatemalanGuyaneseHaitianHmongHonduranHopiHoumaHungarianIcelanderIndian (Asian)IndonesianInupiatIranianIraqiIrishIroquoisIsraeliItalianJamaicanJapaneseJordanianKenyanKiowaKoreanLaotianLatvianLebaneseLiberianLithuanianLumbeeLuxembourgerMacedonianMalaysianMalteseMarshalleseMenomineeMexicanMexican American IndianMongolianMoroccanNative HawaiianNavajoNepaleseNew ZealanderNicaraguanNigerianNorthern EuropeanNorwegianOkinawanOsageOttawaPaiutePakistaniPalestinianPanamanianParaguayanPennsylvania GermanPeruvianPimaPolishPortuguesePotawatomiPuebloPuerto RicanPuget Sound SalishRomanianRussianSalvadoranSamoanScandinavianScotch-IrishScottishSeminoleSenegaleseSerbianShoshoneSierra LeoneanSiouxSlavicSlovakSloveneSomaliSouth AfricanSouth AmericanSouth American IndianSoviet UnionSpaniardSpanishSpanish AmericanSpanish American IndianSri LankanSubsaharan AfricanSudaneseSwedishSwissSyrianTaiwaneseThaiTlingit-HaidaTohono O'OdhamTonganTrinidadian and TobagonianTsimshianTurkishU.S. Virgin IslanderUgandanUkrainianUruguayanUteVenezuelanVietnameseWelshWest IndianYakamaYaquiYugoslavianYumanYup'ikZimbabwean
Immigration
NonimmigrantsImmigrantsAfghanistanAfricaAlbaniaArgentinaArmeniaAsiaAustraliaAustriaBahamasBangladeshBarbadosBelarusBelgiumBelizeBoliviaBosnia and HerzegovinaBrazilBulgariaBurma/MyanmarCabo VerdeCambodiaCameroonCanadaCaribbeanCentral AmericaChileChinaColombiaCongoCosta RicaCroatiaCubaCzechoslovakiaDenmarkDominicaDominican RepublicEastern AfricaEastern AsiaEastern EuropeEcuadorEgyptEl SalvadorEnglandEritreaEthiopiaEuropeFijiFranceGermanyGhanaGreeceGrenadaGuatemalaGuyanaHaitiHondurasHong KongHungaryIndiaIndonesiaIranIraqIrelandIsraelItalyJamaicaJapanJordanKazakhstanKenyaKoreaKuwaitLaosLatin AmericaLatviaLebanonLiberiaLithuaniaMalaysiaMexicoMicronesiaMiddle AfricaMoldovaMoroccoNepalNetherlandsNicaraguaNigeriaNorth AmericaNorth MacedoniaNorthern AfricaNorthern EuropeNorwayOceaniaPakistanPanamaPeruPhilippinesPolandPortugalRomaniaRussiaSaudi ArabiaScotlandSenegalSerbiaSierra LeoneSingaporeSomaliaSouth AfricaSouth AmericaSouth Central AsiaSouth Eastern AsiaSouthern EuropeSpainSri LankaSt. Vincent and the GrenadinesSudanSwedenSwitzerlandSyriaTaiwanTrinidad and TobagoTurkeyUgandaUkraineUruguayUzbekistanVenezuelaVietnamWest IndiesWestern AfricaWestern AsiaWestern EuropeYemenZaireZimbabweAzores
Immigrants from Thailand
Race
Ancestry
AfghanAfricanAlaska NativeAlaskan AthabascanAlbanianAleutAlsatianAmericanApacheArabArapahoArgentineanArmenianAssyrian/Chaldean/SyriacAustralianAustrianBahamianBangladeshiBarbadianBasqueBelgianBelizeanBermudanBhutaneseBlackfeetBolivianBrazilianBritishBritish West IndianBulgarianBurmeseCajunCambodianCanadianCape VerdeanCarpatho RusynCelticCentral AmericanCentral American IndianCherokeeCheyenneChickasawChileanChineseChippewaChoctawColombianColvilleComancheCosta RicanCreeCreekCroatianCrowCubanCypriotCzechCzechoslovakianDanishDelawareDominicanDutchDutch West IndianEastern EuropeanEcuadorianEgyptianEnglishEstonianEthiopianEuropeanFijianFilipinoFinnishFrenchFrench American IndianFrench CanadianGermanGerman RussianGhanaianGreekGuamanian/ChamorroGuatemalanGuyaneseHaitianHmongHonduranHopiHoumaHungarianIcelanderIndian (Asian)IndonesianInupiatIranianIraqiIrishIroquoisIsraeliItalianJamaicanJapaneseJordanianKenyanKiowaKoreanLaotianLatvianLebaneseLiberianLithuanianLumbeeLuxembourgerMacedonianMalaysianMalteseMarshalleseMenomineeMexicanMexican American IndianMongolianMoroccanNative HawaiianNavajoNepaleseNew ZealanderNicaraguanNigerianNorthern EuropeanNorwegianOkinawanOsageOttawaPaiutePakistaniPalestinianPanamanianParaguayanPennsylvania GermanPeruvianPimaPolishPortuguesePotawatomiPuebloPuerto RicanPuget Sound SalishRomanianRussianSalvadoranSamoanScandinavianScotch-IrishScottishSeminoleSenegaleseSerbianShoshoneSierra LeoneanSiouxSlavicSlovakSloveneSomaliSouth AfricanSouth AmericanSouth American IndianSoviet UnionSpaniardSpanishSpanish AmericanSpanish American IndianSri LankanSubsaharan AfricanSudaneseSwedishSwissSyrianTaiwaneseThaiTlingit-HaidaTohono O'OdhamTonganTrinidadian and TobagonianTsimshianTurkishU.S. Virgin IslanderUgandanUkrainianUruguayanUteVenezuelanVietnameseWelshWest IndianYakamaYaquiYugoslavianYumanYup'ikZimbabwean
Immigration
NonimmigrantsImmigrantsAfghanistanAfricaAlbaniaArgentinaArmeniaAsiaAustraliaAustriaBahamasBangladeshBarbadosBelarusBelgiumBelizeBoliviaBosnia and HerzegovinaBrazilBulgariaBurma/MyanmarCabo VerdeCambodiaCameroonCanadaCaribbeanCentral AmericaChileChinaColombiaCongoCosta RicaCroatiaCubaCzechoslovakiaDenmarkDominicaDominican RepublicEastern AfricaEastern AsiaEastern EuropeEcuadorEgyptEl SalvadorEnglandEritreaEthiopiaEuropeFijiFranceGermanyGhanaGrenadaGuatemalaGuyanaHaitiHondurasHong KongHungaryIndiaIndonesiaIranIraqIrelandIsraelItalyJamaicaJapanJordanKazakhstanKenyaKoreaKuwaitLaosLatin AmericaLatviaLebanonLiberiaLithuaniaMalaysiaMexicoMicronesiaMiddle AfricaMoldovaMoroccoNepalNetherlandsNicaraguaNigeriaNorth AmericaNorth MacedoniaNorthern AfricaNorthern EuropeNorwayOceaniaPakistanPanamaPeruPhilippinesPolandPortugalRomaniaRussiaSaudi ArabiaScotlandSenegalSerbiaSierra LeoneSingaporeSomaliaSouth AfricaSouth AmericaSouth Central AsiaSouth Eastern AsiaSouthern EuropeSpainSri LankaSt. Vincent and the GrenadinesSudanSwedenSwitzerlandSyriaTaiwanThailandTrinidad and TobagoTurkeyUgandaUkraineUruguayUzbekistanVenezuelaVietnamWest IndiesWestern AfricaWestern AsiaWestern EuropeYemenZaireZimbabweAzores
Disability Age 65 to 74
Income
Poverty
Unemployment
Labor Participation
Family Structure
Vehicle Availability
Education Level
Disability

Disability Age 65 to 74 Comparison

Immigrants from Greece

Immigrants from Thailand

Exceptional
Tragic
21.0%
DISABILITY AGE 65 TO 74
99.9/ 100
METRIC RATING
30th/ 347
METRIC RANK
24.3%
DISABILITY AGE 65 TO 74
5.2/ 100
METRIC RATING
231st/ 347
METRIC RANK

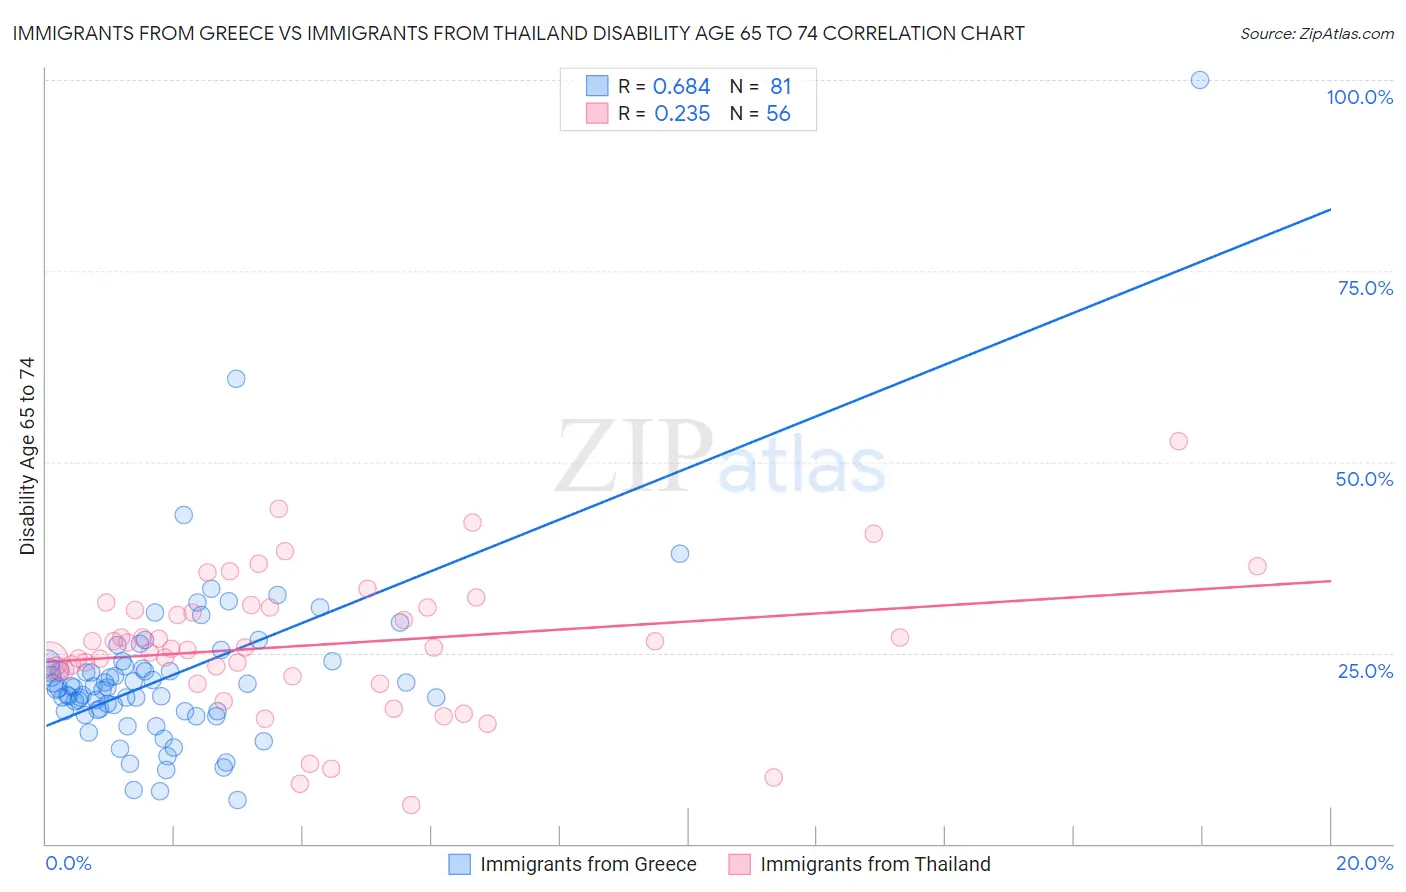
Immigrants from Greece vs Immigrants from Thailand Disability Age 65 to 74 Correlation Chart

The statistical analysis conducted on geographies consisting of 216,768,071 people shows a significant positive correlation between the proportion of Immigrants from Greece and percentage of population with a disability between the ages 65 and 75 in the United States with a correlation coefficient (R) of 0.684 and weighted average of 21.0%. Similarly, the statistical analysis conducted on geographies consisting of 316,664,344 people shows a weak positive correlation between the proportion of Immigrants from Thailand and percentage of population with a disability between the ages 65 and 75 in the United States with a correlation coefficient (R) of 0.235 and weighted average of 24.3%, a difference of 15.7%.
Immigrants from Greece vs Immigrants from Thailand Disability Age 65 to 74

Disability Age 65 to 74 Correlation Summary

MeasurementImmigrants from GreeceImmigrants from Thailand
Minimum5.8%5.0%
Maximum100.0%52.8%
Range94.2%47.8%
Mean22.0%26.0%
Median20.5%25.7%
Interquartile 25% (IQ1)17.4%22.4%
Interquartile 75% (IQ3)23.4%31.0%
Interquartile Range (IQR)6.0%8.6%
Standard Deviation (Sample)11.9%9.1%
Standard Deviation (Population)11.8%9.0%

Similar Demographics by Disability Age 65 to 74

Demographics Similar to Immigrants from Greece by Disability Age 65 to 74

In terms of disability age 65 to 74, the demographic groups most similar to Immigrants from Greece are Immigrants from Japan (21.0%, a difference of 0.040%), Immigrants from Northern Europe (21.0%, a difference of 0.040%), Turkish (21.0%, a difference of 0.070%), Immigrants from Czechoslovakia (21.0%, a difference of 0.080%), and Immigrants from Sweden (21.0%, a difference of 0.18%).
DemographicsRating | RankDisability Age 65 to 74
Immigrants | Belgium
99.9
/100
|
#23
Exceptional
21.0%
Soviet Union
99.9
/100
|
#24
Exceptional
21.0%
Bolivians
99.9
/100
|
#25
Exceptional
21.0%
Immigrants | Australia
99.9
/100
|
#26
Exceptional
21.0%
Immigrants | Sweden
99.9
/100
|
#27
Exceptional
21.0%
Immigrants | Czechoslovakia
99.9
/100
|
#28
Exceptional
21.0%
Immigrants | Japan
99.9
/100
|
#29
Exceptional
21.0%
Immigrants | Greece
99.9
/100
|
#30
Exceptional
21.0%
Immigrants | Northern Europe
99.9
/100
|
#31
Exceptional
21.0%
Turks
99.9
/100
|
#32
Exceptional
21.0%
Immigrants | Argentina
99.9
/100
|
#33
Exceptional
21.1%
Immigrants | Sri Lanka
99.9
/100
|
#34
Exceptional
21.1%
Bulgarians
99.9
/100
|
#35
Exceptional
21.1%
Immigrants | Switzerland
99.8
/100
|
#36
Exceptional
21.1%
Israelis
99.8
/100
|
#37
Exceptional
21.2%

Demographics Similar to Immigrants from Thailand by Disability Age 65 to 74

In terms of disability age 65 to 74, the demographic groups most similar to Immigrants from Thailand are Immigrants from Zaire (24.3%, a difference of 0.050%), Barbadian (24.3%, a difference of 0.20%), Bahamian (24.4%, a difference of 0.21%), Celtic (24.2%, a difference of 0.31%), and Panamanian (24.4%, a difference of 0.32%).
DemographicsRating | RankDisability Age 65 to 74
Immigrants | Panama
8.6
/100
|
#224
Tragic
24.1%
Bermudans
8.2
/100
|
#225
Tragic
24.2%
Iraqis
8.1
/100
|
#226
Tragic
24.2%
Nigerians
7.8
/100
|
#227
Tragic
24.2%
Whites/Caucasians
6.6
/100
|
#228
Tragic
24.2%
Celtics
6.4
/100
|
#229
Tragic
24.2%
Barbadians
6.0
/100
|
#230
Tragic
24.3%
Immigrants | Thailand
5.2
/100
|
#231
Tragic
24.3%
Immigrants | Zaire
5.0
/100
|
#232
Tragic
24.3%
Bahamians
4.5
/100
|
#233
Tragic
24.4%
Panamanians
4.2
/100
|
#234
Tragic
24.4%
Scotch-Irish
3.8
/100
|
#235
Tragic
24.4%
German Russians
3.7
/100
|
#236
Tragic
24.4%
West Indians
3.4
/100
|
#237
Tragic
24.5%
Immigrants | Ghana
3.0
/100
|
#238
Tragic
24.5%