Immigrants from North America vs Immigrants from Thailand Disability Age 65 to 74
COMPARE
Immigrants from North America
Immigrants from Thailand
Disability Age 65 to 74
Disability Age 65 to 74 Comparison
Immigrants from North America
Immigrants from Thailand
22.1%
DISABILITY AGE 65 TO 74
97.5/ 100
METRIC RATING
96th/ 347
METRIC RANK
24.3%
DISABILITY AGE 65 TO 74
5.2/ 100
METRIC RATING
231st/ 347
METRIC RANK
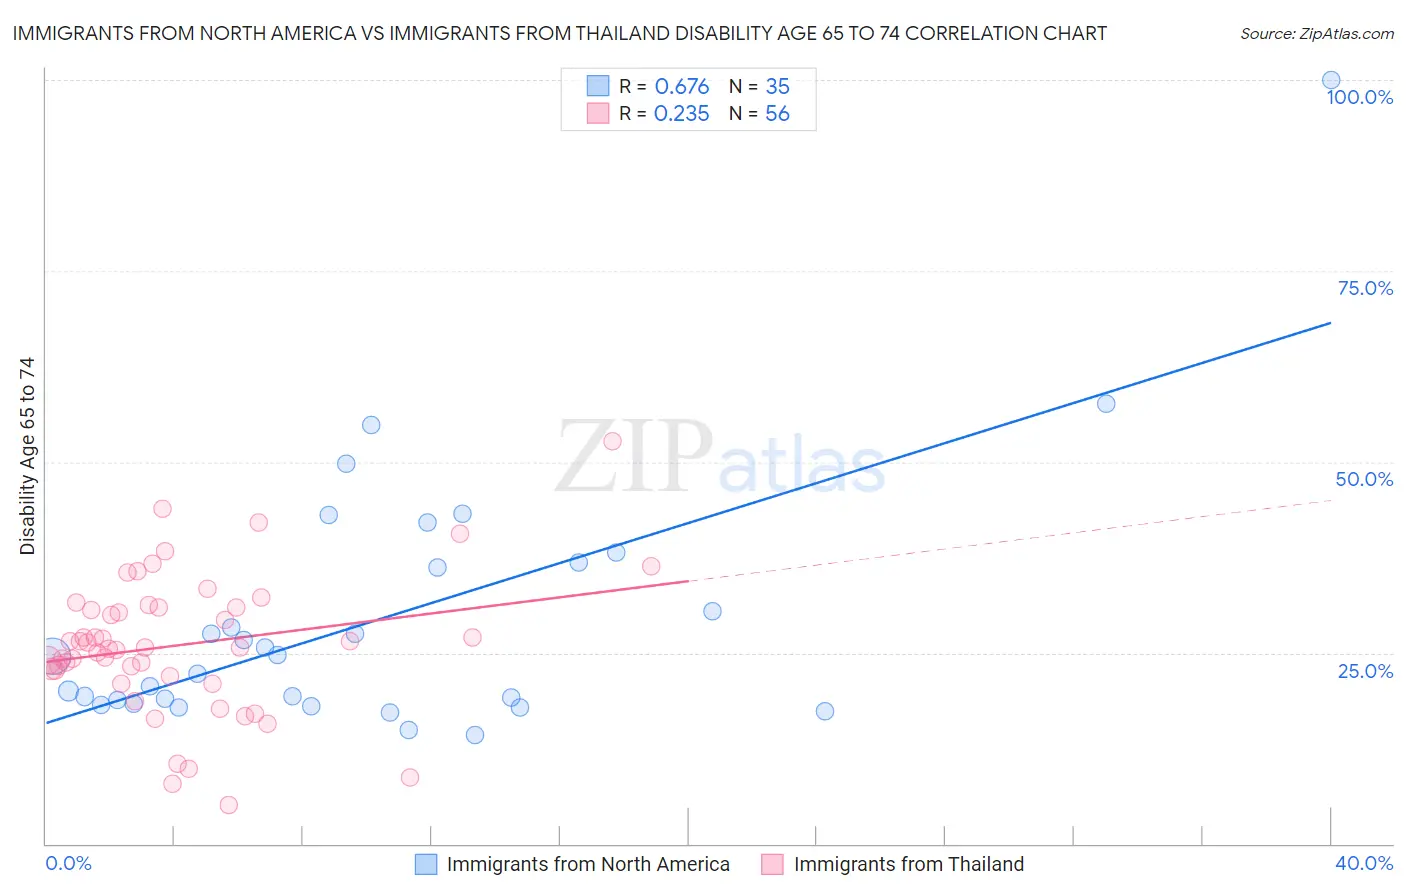
Immigrants from North America vs Immigrants from Thailand Disability Age 65 to 74 Correlation Chart
The statistical analysis conducted on geographies consisting of 461,608,844 people shows a significant positive correlation between the proportion of Immigrants from North America and percentage of population with a disability between the ages 65 and 75 in the United States with a correlation coefficient (R) of 0.676 and weighted average of 22.1%. Similarly, the statistical analysis conducted on geographies consisting of 316,664,344 people shows a weak positive correlation between the proportion of Immigrants from Thailand and percentage of population with a disability between the ages 65 and 75 in the United States with a correlation coefficient (R) of 0.235 and weighted average of 24.3%, a difference of 10.1%.
Disability Age 65 to 74 Correlation Summary
| Measurement | Immigrants from North America | Immigrants from Thailand |
| Minimum | 14.3% | 5.0% |
| Maximum | 100.0% | 52.8% |
| Range | 85.7% | 47.8% |
| Mean | 29.4% | 26.0% |
| Median | 24.5% | 25.7% |
| Interquartile 25% (IQ1) | 18.3% | 22.4% |
| Interquartile 75% (IQ3) | 36.8% | 31.0% |
| Interquartile Range (IQR) | 18.5% | 8.6% |
| Standard Deviation (Sample) | 16.9% | 9.1% |
| Standard Deviation (Population) | 16.7% | 9.0% |
Similar Demographics by Disability Age 65 to 74
Demographics Similar to Immigrants from North America by Disability Age 65 to 74
In terms of disability age 65 to 74, the demographic groups most similar to Immigrants from North America are Romanian (22.1%, a difference of 0.11%), Immigrants from Southern Europe (22.1%, a difference of 0.15%), Immigrants from Chile (22.1%, a difference of 0.17%), Immigrants from Canada (22.1%, a difference of 0.19%), and Polish (22.0%, a difference of 0.21%).
| Demographics | Rating | Rank | Disability Age 65 to 74 |
| Immigrants | Kuwait | 97.9 /100 | #89 | Exceptional 22.0% |
| Italians | 97.9 /100 | #90 | Exceptional 22.0% |
| Chileans | 97.9 /100 | #91 | Exceptional 22.0% |
| Poles | 97.8 /100 | #92 | Exceptional 22.0% |
| Immigrants | Canada | 97.8 /100 | #93 | Exceptional 22.1% |
| Immigrants | Chile | 97.7 /100 | #94 | Exceptional 22.1% |
| Romanians | 97.7 /100 | #95 | Exceptional 22.1% |
| Immigrants | North America | 97.5 /100 | #96 | Exceptional 22.1% |
| Immigrants | Southern Europe | 97.2 /100 | #97 | Exceptional 22.1% |
| Jordanians | 96.9 /100 | #98 | Exceptional 22.2% |
| Immigrants | Colombia | 96.8 /100 | #99 | Exceptional 22.2% |
| Uruguayans | 96.5 /100 | #100 | Exceptional 22.2% |
| Immigrants | England | 96.5 /100 | #101 | Exceptional 22.2% |
| Immigrants | Saudi Arabia | 96.4 /100 | #102 | Exceptional 22.2% |
| South Americans | 96.4 /100 | #103 | Exceptional 22.2% |
Demographics Similar to Immigrants from Thailand by Disability Age 65 to 74
In terms of disability age 65 to 74, the demographic groups most similar to Immigrants from Thailand are Immigrants from Zaire (24.3%, a difference of 0.050%), Barbadian (24.3%, a difference of 0.20%), Bahamian (24.4%, a difference of 0.21%), Celtic (24.2%, a difference of 0.31%), and Panamanian (24.4%, a difference of 0.32%).
| Demographics | Rating | Rank | Disability Age 65 to 74 |
| Immigrants | Panama | 8.6 /100 | #224 | Tragic 24.1% |
| Bermudans | 8.2 /100 | #225 | Tragic 24.2% |
| Iraqis | 8.1 /100 | #226 | Tragic 24.2% |
| Nigerians | 7.8 /100 | #227 | Tragic 24.2% |
| Whites/Caucasians | 6.6 /100 | #228 | Tragic 24.2% |
| Celtics | 6.4 /100 | #229 | Tragic 24.2% |
| Barbadians | 6.0 /100 | #230 | Tragic 24.3% |
| Immigrants | Thailand | 5.2 /100 | #231 | Tragic 24.3% |
| Immigrants | Zaire | 5.0 /100 | #232 | Tragic 24.3% |
| Bahamians | 4.5 /100 | #233 | Tragic 24.4% |
| Panamanians | 4.2 /100 | #234 | Tragic 24.4% |
| Scotch-Irish | 3.8 /100 | #235 | Tragic 24.4% |
| German Russians | 3.7 /100 | #236 | Tragic 24.4% |
| West Indians | 3.4 /100 | #237 | Tragic 24.5% |
| Immigrants | Ghana | 3.0 /100 | #238 | Tragic 24.5% |