Celtic vs Immigrants from Northern Europe In Labor Force | Age 20-24
COMPARE
Celtic
Immigrants from Northern Europe
In Labor Force | Age 20-24
In Labor Force | Age 20-24 Comparison
Celtics
Immigrants from Northern Europe
77.1%
IN LABOR FORCE | AGE 20-24
99.9/ 100
METRIC RATING
54th/ 347
METRIC RANK
74.8%
IN LABOR FORCE | AGE 20-24
32.6/ 100
METRIC RATING
189th/ 347
METRIC RANK
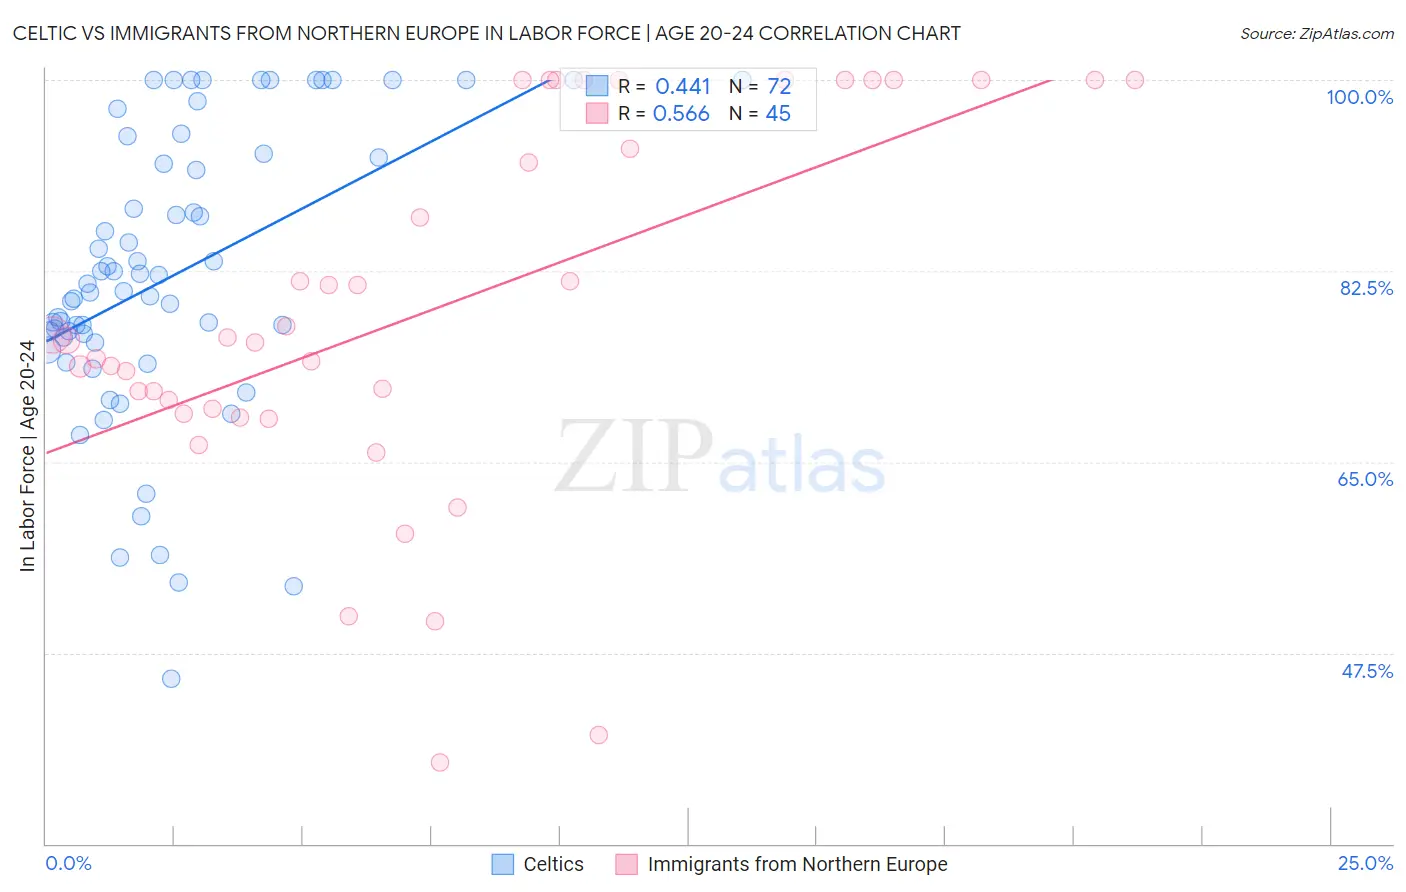
Celtic vs Immigrants from Northern Europe In Labor Force | Age 20-24 Correlation Chart
The statistical analysis conducted on geographies consisting of 168,822,890 people shows a moderate positive correlation between the proportion of Celtics and labor force participation rate among population between the ages 20 and 24 in the United States with a correlation coefficient (R) of 0.441 and weighted average of 77.1%. Similarly, the statistical analysis conducted on geographies consisting of 476,778,788 people shows a substantial positive correlation between the proportion of Immigrants from Northern Europe and labor force participation rate among population between the ages 20 and 24 in the United States with a correlation coefficient (R) of 0.566 and weighted average of 74.8%, a difference of 3.0%.
In Labor Force | Age 20-24 Correlation Summary
| Measurement | Celtic | Immigrants from Northern Europe |
| Minimum | 45.2% | 37.5% |
| Maximum | 100.0% | 100.0% |
| Range | 54.8% | 62.5% |
| Mean | 82.1% | 78.8% |
| Median | 81.0% | 76.1% |
| Interquartile 25% (IQ1) | 76.2% | 69.6% |
| Interquartile 75% (IQ3) | 93.0% | 100.0% |
| Interquartile Range (IQR) | 16.9% | 30.4% |
| Standard Deviation (Sample) | 13.2% | 16.9% |
| Standard Deviation (Population) | 13.1% | 16.7% |
Similar Demographics by In Labor Force | Age 20-24
Demographics Similar to Celtics by In Labor Force | Age 20-24
In terms of in labor force | age 20-24, the demographic groups most similar to Celtics are Immigrants from Liberia (77.1%, a difference of 0.020%), European (77.1%, a difference of 0.030%), Chippewa (77.1%, a difference of 0.040%), Hawaiian (77.0%, a difference of 0.060%), and Scotch-Irish (77.0%, a difference of 0.090%).
| Demographics | Rating | Rank | In Labor Force | Age 20-24 |
| Ethiopians | 100.0 /100 | #47 | Exceptional 77.3% |
| Serbians | 100.0 /100 | #48 | Exceptional 77.3% |
| Chinese | 100.0 /100 | #49 | Exceptional 77.3% |
| Malaysians | 100.0 /100 | #50 | Exceptional 77.2% |
| Croatians | 100.0 /100 | #51 | Exceptional 77.2% |
| Indonesians | 100.0 /100 | #52 | Exceptional 77.2% |
| Immigrants | Azores | 100.0 /100 | #53 | Exceptional 77.2% |
| Celtics | 99.9 /100 | #54 | Exceptional 77.1% |
| Immigrants | Liberia | 99.9 /100 | #55 | Exceptional 77.1% |
| Europeans | 99.9 /100 | #56 | Exceptional 77.1% |
| Chippewa | 99.9 /100 | #57 | Exceptional 77.1% |
| Hawaiians | 99.9 /100 | #58 | Exceptional 77.0% |
| Scotch-Irish | 99.9 /100 | #59 | Exceptional 77.0% |
| Kenyans | 99.9 /100 | #60 | Exceptional 77.0% |
| Immigrants | Eritrea | 99.9 /100 | #61 | Exceptional 77.0% |
Demographics Similar to Immigrants from Northern Europe by In Labor Force | Age 20-24
In terms of in labor force | age 20-24, the demographic groups most similar to Immigrants from Northern Europe are Honduran (74.8%, a difference of 0.0%), Immigrants from Honduras (74.9%, a difference of 0.010%), Russian (74.8%, a difference of 0.010%), Immigrants from Eastern Europe (74.9%, a difference of 0.020%), and Immigrants from Hungary (74.9%, a difference of 0.040%).
| Demographics | Rating | Rank | In Labor Force | Age 20-24 |
| Immigrants | South Africa | 36.9 /100 | #182 | Fair 74.9% |
| Immigrants | Costa Rica | 36.7 /100 | #183 | Fair 74.9% |
| Immigrants | Hungary | 35.0 /100 | #184 | Fair 74.9% |
| Sri Lankans | 34.9 /100 | #185 | Fair 74.9% |
| Immigrants | Eastern Europe | 33.8 /100 | #186 | Fair 74.9% |
| Immigrants | Honduras | 33.5 /100 | #187 | Fair 74.9% |
| Hondurans | 32.7 /100 | #188 | Fair 74.8% |
| Immigrants | Northern Europe | 32.6 /100 | #189 | Fair 74.8% |
| Russians | 32.2 /100 | #190 | Fair 74.8% |
| Senegalese | 28.1 /100 | #191 | Fair 74.8% |
| Immigrants | Europe | 27.5 /100 | #192 | Fair 74.8% |
| Alsatians | 27.1 /100 | #193 | Fair 74.8% |
| Immigrants | Denmark | 25.8 /100 | #194 | Fair 74.8% |
| Eastern Europeans | 25.4 /100 | #195 | Fair 74.8% |
| Immigrants | Vietnam | 25.1 /100 | #196 | Fair 74.7% |