Immigrants from Thailand vs Immigrants from Israel Ambulatory Disability
COMPARE
Immigrants from Thailand
Immigrants from Israel
Ambulatory Disability
Ambulatory Disability Comparison
Immigrants from Thailand
Immigrants from Israel
6.1%
AMBULATORY DISABILITY
42.2/ 100
METRIC RATING
183rd/ 347
METRIC RANK
5.4%
AMBULATORY DISABILITY
100.0/ 100
METRIC RATING
22nd/ 347
METRIC RANK
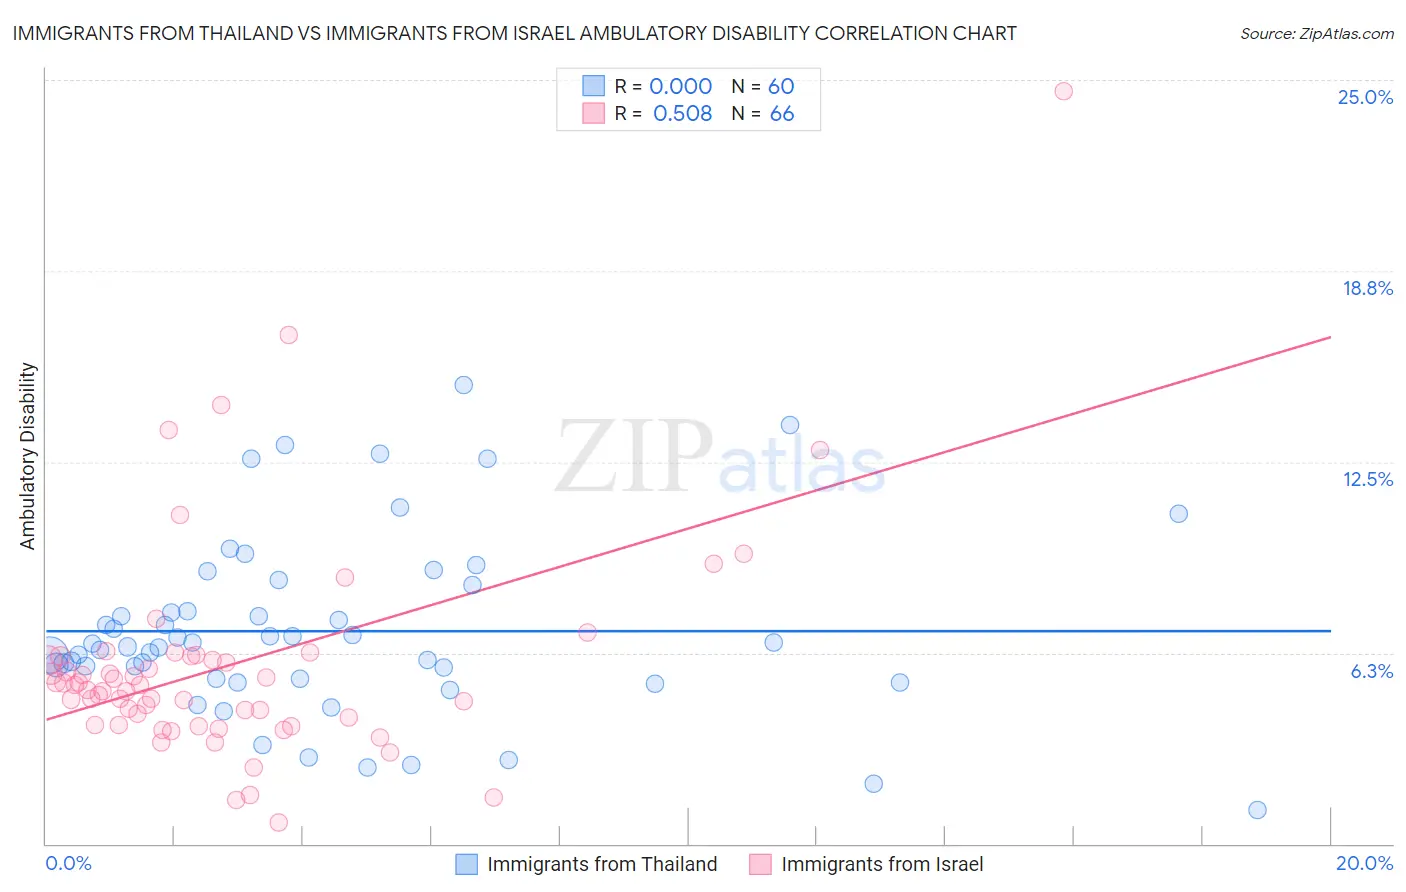
Immigrants from Thailand vs Immigrants from Israel Ambulatory Disability Correlation Chart
The statistical analysis conducted on geographies consisting of 316,957,387 people shows no correlation between the proportion of Immigrants from Thailand and percentage of population with ambulatory disability in the United States with a correlation coefficient (R) of 0.000 and weighted average of 6.1%. Similarly, the statistical analysis conducted on geographies consisting of 210,002,102 people shows a substantial positive correlation between the proportion of Immigrants from Israel and percentage of population with ambulatory disability in the United States with a correlation coefficient (R) of 0.508 and weighted average of 5.4%, a difference of 14.1%.
Ambulatory Disability Correlation Summary
| Measurement | Immigrants from Thailand | Immigrants from Israel |
| Minimum | 1.1% | 0.69% |
| Maximum | 15.0% | 24.6% |
| Range | 13.9% | 24.0% |
| Mean | 7.0% | 5.8% |
| Median | 6.5% | 5.1% |
| Interquartile 25% (IQ1) | 5.4% | 3.9% |
| Interquartile 75% (IQ3) | 8.0% | 6.1% |
| Interquartile Range (IQR) | 2.6% | 2.2% |
| Standard Deviation (Sample) | 2.9% | 3.7% |
| Standard Deviation (Population) | 2.9% | 3.7% |
Similar Demographics by Ambulatory Disability
Demographics Similar to Immigrants from Thailand by Ambulatory Disability
In terms of ambulatory disability, the demographic groups most similar to Immigrants from Thailand are Serbian (6.1%, a difference of 0.030%), Swiss (6.1%, a difference of 0.050%), Immigrants from Ghana (6.1%, a difference of 0.050%), Immigrants from Nicaragua (6.1%, a difference of 0.090%), and Austrian (6.1%, a difference of 0.10%).
| Demographics | Rating | Rank | Ambulatory Disability |
| Immigrants | North America | 45.6 /100 | #176 | Average 6.1% |
| Immigrants | England | 45.4 /100 | #177 | Average 6.1% |
| Scandinavians | 44.5 /100 | #178 | Average 6.1% |
| Austrians | 44.1 /100 | #179 | Average 6.1% |
| Immigrants | Nicaragua | 43.9 /100 | #180 | Average 6.1% |
| Swiss | 43.1 /100 | #181 | Average 6.1% |
| Serbians | 42.8 /100 | #182 | Average 6.1% |
| Immigrants | Thailand | 42.2 /100 | #183 | Average 6.1% |
| Immigrants | Ghana | 41.2 /100 | #184 | Average 6.1% |
| Immigrants | Bosnia and Herzegovina | 37.2 /100 | #185 | Fair 6.2% |
| Europeans | 36.2 /100 | #186 | Fair 6.2% |
| Carpatho Rusyns | 35.3 /100 | #187 | Fair 6.2% |
| British | 34.3 /100 | #188 | Fair 6.2% |
| Ukrainians | 34.0 /100 | #189 | Fair 6.2% |
| Immigrants | Western Africa | 33.4 /100 | #190 | Fair 6.2% |
Demographics Similar to Immigrants from Israel by Ambulatory Disability
In terms of ambulatory disability, the demographic groups most similar to Immigrants from Israel are Tongan (5.4%, a difference of 0.040%), Immigrants from Saudi Arabia (5.4%, a difference of 0.13%), Zimbabwean (5.4%, a difference of 0.21%), Immigrants from Nepal (5.4%, a difference of 0.25%), and Ethiopian (5.4%, a difference of 0.37%).
| Demographics | Rating | Rank | Ambulatory Disability |
| Immigrants | China | 100.0 /100 | #15 | Exceptional 5.3% |
| Immigrants | Hong Kong | 100.0 /100 | #16 | Exceptional 5.3% |
| Immigrants | Ethiopia | 100.0 /100 | #17 | Exceptional 5.4% |
| Immigrants | Sri Lanka | 100.0 /100 | #18 | Exceptional 5.4% |
| Indians (Asian) | 100.0 /100 | #19 | Exceptional 5.4% |
| Ethiopians | 100.0 /100 | #20 | Exceptional 5.4% |
| Immigrants | Kuwait | 100.0 /100 | #21 | Exceptional 5.4% |
| Immigrants | Israel | 100.0 /100 | #22 | Exceptional 5.4% |
| Tongans | 100.0 /100 | #23 | Exceptional 5.4% |
| Immigrants | Saudi Arabia | 100.0 /100 | #24 | Exceptional 5.4% |
| Zimbabweans | 100.0 /100 | #25 | Exceptional 5.4% |
| Immigrants | Nepal | 100.0 /100 | #26 | Exceptional 5.4% |
| Asians | 100.0 /100 | #27 | Exceptional 5.4% |
| Cambodians | 100.0 /100 | #28 | Exceptional 5.4% |
| Immigrants | Iran | 100.0 /100 | #29 | Exceptional 5.4% |