Palestinian vs Immigrants from Israel Ambulatory Disability
COMPARE
Palestinian
Immigrants from Israel
Ambulatory Disability
Ambulatory Disability Comparison
Palestinians
Immigrants from Israel
5.7%
AMBULATORY DISABILITY
99.2/ 100
METRIC RATING
82nd/ 347
METRIC RANK
5.4%
AMBULATORY DISABILITY
100.0/ 100
METRIC RATING
22nd/ 347
METRIC RANK
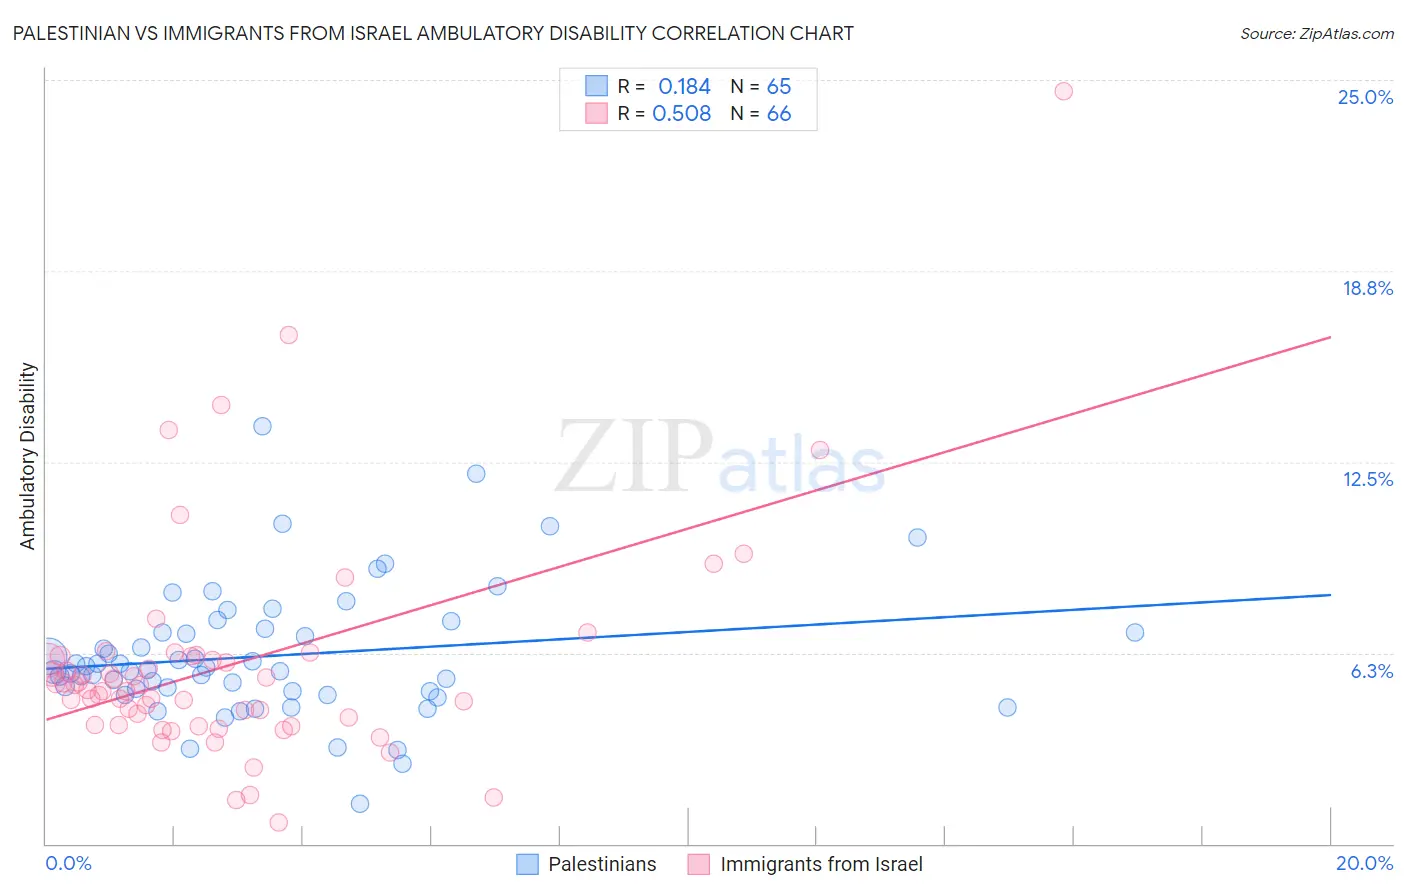
Palestinian vs Immigrants from Israel Ambulatory Disability Correlation Chart
The statistical analysis conducted on geographies consisting of 216,450,834 people shows a poor positive correlation between the proportion of Palestinians and percentage of population with ambulatory disability in the United States with a correlation coefficient (R) of 0.184 and weighted average of 5.7%. Similarly, the statistical analysis conducted on geographies consisting of 210,002,102 people shows a substantial positive correlation between the proportion of Immigrants from Israel and percentage of population with ambulatory disability in the United States with a correlation coefficient (R) of 0.508 and weighted average of 5.4%, a difference of 6.5%.
Ambulatory Disability Correlation Summary
| Measurement | Palestinian | Immigrants from Israel |
| Minimum | 1.3% | 0.69% |
| Maximum | 13.7% | 24.6% |
| Range | 12.3% | 24.0% |
| Mean | 6.2% | 5.8% |
| Median | 5.7% | 5.1% |
| Interquartile 25% (IQ1) | 5.0% | 3.9% |
| Interquartile 75% (IQ3) | 7.0% | 6.1% |
| Interquartile Range (IQR) | 2.0% | 2.2% |
| Standard Deviation (Sample) | 2.1% | 3.7% |
| Standard Deviation (Population) | 2.1% | 3.7% |
Similar Demographics by Ambulatory Disability
Demographics Similar to Palestinians by Ambulatory Disability
In terms of ambulatory disability, the demographic groups most similar to Palestinians are Immigrants from Jordan (5.7%, a difference of 0.0%), Immigrants from Ireland (5.7%, a difference of 0.010%), Eastern European (5.7%, a difference of 0.020%), Ugandan (5.7%, a difference of 0.020%), and Chilean (5.7%, a difference of 0.14%).
| Demographics | Rating | Rank | Ambulatory Disability |
| Immigrants | South Africa | 99.3 /100 | #75 | Exceptional 5.7% |
| Sudanese | 99.3 /100 | #76 | Exceptional 5.7% |
| Immigrants | Vietnam | 99.3 /100 | #77 | Exceptional 5.7% |
| Somalis | 99.2 /100 | #78 | Exceptional 5.7% |
| Chileans | 99.2 /100 | #79 | Exceptional 5.7% |
| Immigrants | Ireland | 99.2 /100 | #80 | Exceptional 5.7% |
| Immigrants | Jordan | 99.2 /100 | #81 | Exceptional 5.7% |
| Palestinians | 99.2 /100 | #82 | Exceptional 5.7% |
| Eastern Europeans | 99.2 /100 | #83 | Exceptional 5.7% |
| Ugandans | 99.2 /100 | #84 | Exceptional 5.7% |
| South Americans | 99.0 /100 | #85 | Exceptional 5.7% |
| Latvians | 99.0 /100 | #86 | Exceptional 5.7% |
| Immigrants | Chile | 98.9 /100 | #87 | Exceptional 5.8% |
| Soviet Union | 98.9 /100 | #88 | Exceptional 5.8% |
| Bhutanese | 98.8 /100 | #89 | Exceptional 5.8% |
Demographics Similar to Immigrants from Israel by Ambulatory Disability
In terms of ambulatory disability, the demographic groups most similar to Immigrants from Israel are Tongan (5.4%, a difference of 0.040%), Immigrants from Saudi Arabia (5.4%, a difference of 0.13%), Zimbabwean (5.4%, a difference of 0.21%), Immigrants from Nepal (5.4%, a difference of 0.25%), and Ethiopian (5.4%, a difference of 0.37%).
| Demographics | Rating | Rank | Ambulatory Disability |
| Immigrants | China | 100.0 /100 | #15 | Exceptional 5.3% |
| Immigrants | Hong Kong | 100.0 /100 | #16 | Exceptional 5.3% |
| Immigrants | Ethiopia | 100.0 /100 | #17 | Exceptional 5.4% |
| Immigrants | Sri Lanka | 100.0 /100 | #18 | Exceptional 5.4% |
| Indians (Asian) | 100.0 /100 | #19 | Exceptional 5.4% |
| Ethiopians | 100.0 /100 | #20 | Exceptional 5.4% |
| Immigrants | Kuwait | 100.0 /100 | #21 | Exceptional 5.4% |
| Immigrants | Israel | 100.0 /100 | #22 | Exceptional 5.4% |
| Tongans | 100.0 /100 | #23 | Exceptional 5.4% |
| Immigrants | Saudi Arabia | 100.0 /100 | #24 | Exceptional 5.4% |
| Zimbabweans | 100.0 /100 | #25 | Exceptional 5.4% |
| Immigrants | Nepal | 100.0 /100 | #26 | Exceptional 5.4% |
| Asians | 100.0 /100 | #27 | Exceptional 5.4% |
| Cambodians | 100.0 /100 | #28 | Exceptional 5.4% |
| Immigrants | Iran | 100.0 /100 | #29 | Exceptional 5.4% |