Marshallese vs Immigrants from Hungary Ambulatory Disability
COMPARE
Marshallese
Immigrants from Hungary
Ambulatory Disability
Ambulatory Disability Comparison
Marshallese
Immigrants from Hungary
6.9%
AMBULATORY DISABILITY
0.0/ 100
METRIC RATING
300th/ 347
METRIC RANK
6.0%
AMBULATORY DISABILITY
83.9/ 100
METRIC RATING
138th/ 347
METRIC RANK
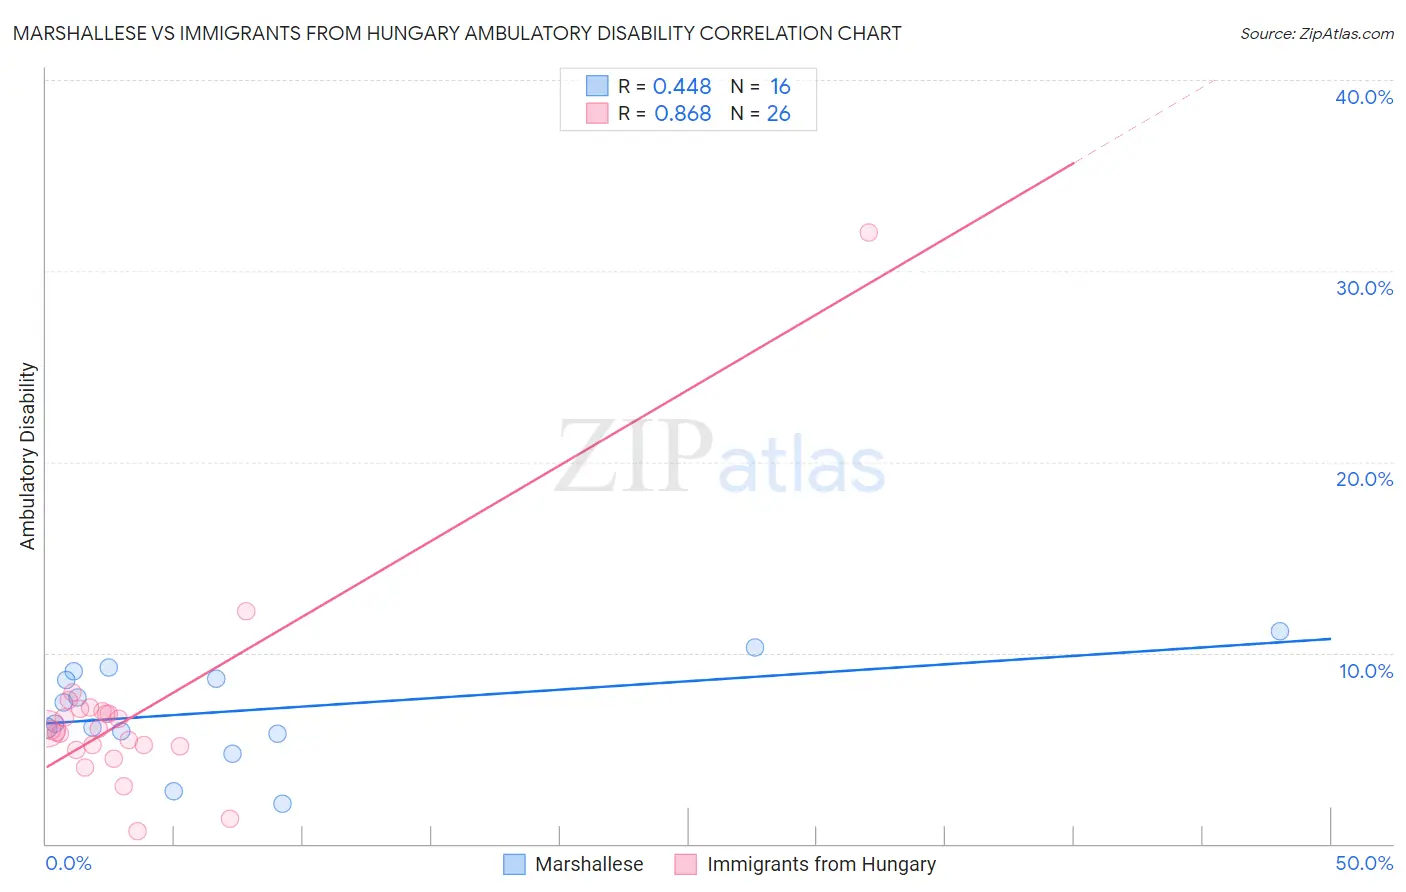
Marshallese vs Immigrants from Hungary Ambulatory Disability Correlation Chart
The statistical analysis conducted on geographies consisting of 14,761,315 people shows a moderate positive correlation between the proportion of Marshallese and percentage of population with ambulatory disability in the United States with a correlation coefficient (R) of 0.448 and weighted average of 6.9%. Similarly, the statistical analysis conducted on geographies consisting of 195,671,605 people shows a very strong positive correlation between the proportion of Immigrants from Hungary and percentage of population with ambulatory disability in the United States with a correlation coefficient (R) of 0.868 and weighted average of 6.0%, a difference of 16.1%.
Ambulatory Disability Correlation Summary
| Measurement | Marshallese | Immigrants from Hungary |
| Minimum | 2.1% | 0.66% |
| Maximum | 11.1% | 32.0% |
| Range | 9.0% | 31.3% |
| Mean | 7.0% | 6.8% |
| Median | 6.8% | 6.0% |
| Interquartile 25% (IQ1) | 5.8% | 5.1% |
| Interquartile 75% (IQ3) | 8.9% | 7.0% |
| Interquartile Range (IQR) | 3.0% | 1.9% |
| Standard Deviation (Sample) | 2.5% | 5.6% |
| Standard Deviation (Population) | 2.4% | 5.5% |
Similar Demographics by Ambulatory Disability
Demographics Similar to Marshallese by Ambulatory Disability
In terms of ambulatory disability, the demographic groups most similar to Marshallese are Puget Sound Salish (6.9%, a difference of 0.010%), Immigrants from Grenada (6.9%, a difference of 0.14%), French American Indian (6.9%, a difference of 0.15%), British West Indian (7.0%, a difference of 0.23%), and Immigrants from Armenia (7.0%, a difference of 0.28%).
| Demographics | Rating | Rank | Ambulatory Disability |
| Immigrants | St. Vincent and the Grenadines | 0.0 /100 | #293 | Tragic 6.9% |
| Cape Verdeans | 0.0 /100 | #294 | Tragic 6.9% |
| Crow | 0.0 /100 | #295 | Tragic 6.9% |
| Alaskan Athabascans | 0.0 /100 | #296 | Tragic 6.9% |
| French American Indians | 0.0 /100 | #297 | Tragic 6.9% |
| Immigrants | Grenada | 0.0 /100 | #298 | Tragic 6.9% |
| Puget Sound Salish | 0.0 /100 | #299 | Tragic 6.9% |
| Marshallese | 0.0 /100 | #300 | Tragic 6.9% |
| British West Indians | 0.0 /100 | #301 | Tragic 7.0% |
| Immigrants | Armenia | 0.0 /100 | #302 | Tragic 7.0% |
| Africans | 0.0 /100 | #303 | Tragic 7.0% |
| Immigrants | Cabo Verde | 0.0 /100 | #304 | Tragic 7.0% |
| Immigrants | Micronesia | 0.0 /100 | #305 | Tragic 7.0% |
| Iroquois | 0.0 /100 | #306 | Tragic 7.1% |
| Spanish Americans | 0.0 /100 | #307 | Tragic 7.1% |
Demographics Similar to Immigrants from Hungary by Ambulatory Disability
In terms of ambulatory disability, the demographic groups most similar to Immigrants from Hungary are Immigrants from North Macedonia (6.0%, a difference of 0.020%), Immigrants from Syria (6.0%, a difference of 0.020%), Immigrants from Zaire (6.0%, a difference of 0.030%), Czech (6.0%, a difference of 0.060%), and Swedish (6.0%, a difference of 0.080%).
| Demographics | Rating | Rank | Ambulatory Disability |
| Immigrants | Costa Rica | 89.5 /100 | #131 | Excellent 5.9% |
| Immigrants | Europe | 87.8 /100 | #132 | Excellent 6.0% |
| Immigrants | Immigrants | 86.9 /100 | #133 | Excellent 6.0% |
| Ute | 86.6 /100 | #134 | Excellent 6.0% |
| Immigrants | Italy | 85.0 /100 | #135 | Excellent 6.0% |
| Immigrants | North Macedonia | 84.1 /100 | #136 | Excellent 6.0% |
| Immigrants | Syria | 84.1 /100 | #137 | Excellent 6.0% |
| Immigrants | Hungary | 83.9 /100 | #138 | Excellent 6.0% |
| Immigrants | Zaire | 83.6 /100 | #139 | Excellent 6.0% |
| Czechs | 83.3 /100 | #140 | Excellent 6.0% |
| Swedes | 83.1 /100 | #141 | Excellent 6.0% |
| Immigrants | Philippines | 83.0 /100 | #142 | Excellent 6.0% |
| Romanians | 82.9 /100 | #143 | Excellent 6.0% |
| Macedonians | 82.8 /100 | #144 | Excellent 6.0% |
| Pakistanis | 82.5 /100 | #145 | Excellent 6.0% |