Cape Verdean vs Yakama Male Disability
COMPARE
Cape Verdean
Yakama
Male Disability
Male Disability Comparison
Cape Verdeans
Yakama
12.8%
MALE DISABILITY
0.0/ 100
METRIC RATING
287th/ 347
METRIC RANK
13.5%
MALE DISABILITY
0.0/ 100
METRIC RATING
312th/ 347
METRIC RANK
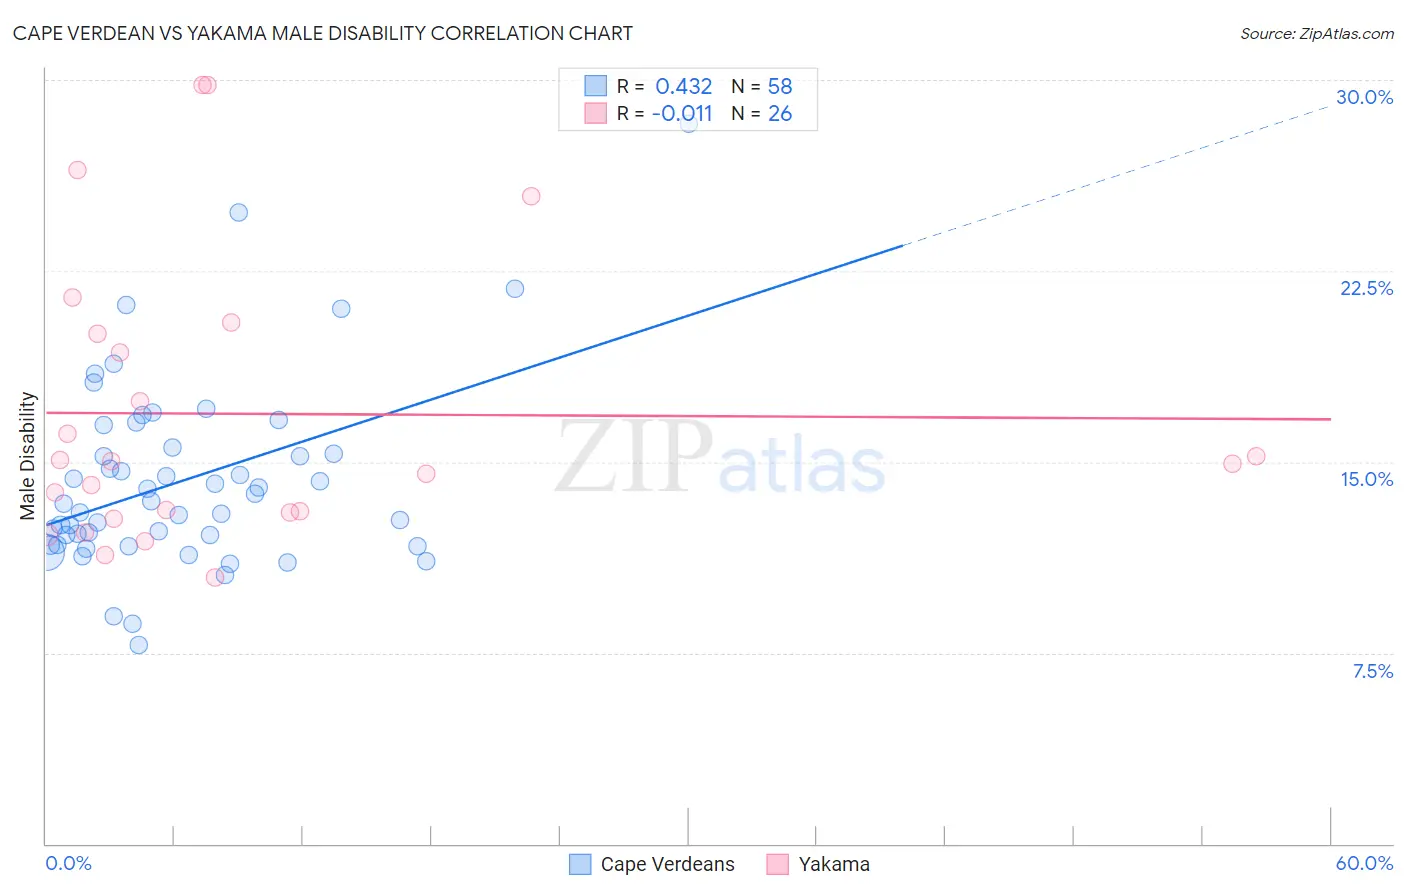
Cape Verdean vs Yakama Male Disability Correlation Chart
The statistical analysis conducted on geographies consisting of 107,575,167 people shows a moderate positive correlation between the proportion of Cape Verdeans and percentage of males with a disability in the United States with a correlation coefficient (R) of 0.432 and weighted average of 12.8%. Similarly, the statistical analysis conducted on geographies consisting of 19,917,759 people shows no correlation between the proportion of Yakama and percentage of males with a disability in the United States with a correlation coefficient (R) of -0.011 and weighted average of 13.5%, a difference of 6.1%.
Male Disability Correlation Summary
| Measurement | Cape Verdean | Yakama |
| Minimum | 7.8% | 10.5% |
| Maximum | 28.3% | 29.8% |
| Range | 20.5% | 19.4% |
| Mean | 14.3% | 16.9% |
| Median | 13.4% | 15.0% |
| Interquartile 25% (IQ1) | 11.7% | 13.0% |
| Interquartile 75% (IQ3) | 15.6% | 20.0% |
| Interquartile Range (IQR) | 3.8% | 7.0% |
| Standard Deviation (Sample) | 3.7% | 5.6% |
| Standard Deviation (Population) | 3.7% | 5.5% |
Similar Demographics by Male Disability
Demographics Similar to Cape Verdeans by Male Disability
In terms of male disability, the demographic groups most similar to Cape Verdeans are Scottish (12.8%, a difference of 0.070%), Welsh (12.7%, a difference of 0.12%), Spanish (12.7%, a difference of 0.13%), Yup'ik (12.8%, a difference of 0.19%), and Immigrants from Cabo Verde (12.8%, a difference of 0.38%).
| Demographics | Rating | Rank | Male Disability |
| Dutch | 0.0 /100 | #280 | Tragic 12.7% |
| Sioux | 0.0 /100 | #281 | Tragic 12.7% |
| Irish | 0.0 /100 | #282 | Tragic 12.7% |
| Germans | 0.0 /100 | #283 | Tragic 12.7% |
| Spanish | 0.0 /100 | #284 | Tragic 12.7% |
| Welsh | 0.0 /100 | #285 | Tragic 12.7% |
| Scottish | 0.0 /100 | #286 | Tragic 12.8% |
| Cape Verdeans | 0.0 /100 | #287 | Tragic 12.8% |
| Yup'ik | 0.0 /100 | #288 | Tragic 12.8% |
| Immigrants | Cabo Verde | 0.0 /100 | #289 | Tragic 12.8% |
| Pima | 0.0 /100 | #290 | Tragic 12.8% |
| Whites/Caucasians | 0.0 /100 | #291 | Tragic 12.8% |
| English | 0.0 /100 | #292 | Tragic 12.8% |
| Yaqui | 0.0 /100 | #293 | Tragic 12.9% |
| Marshallese | 0.0 /100 | #294 | Tragic 12.9% |
Demographics Similar to Yakama by Male Disability
In terms of male disability, the demographic groups most similar to Yakama are Puget Sound Salish (13.5%, a difference of 0.020%), Aleut (13.5%, a difference of 0.080%), Iroquois (13.6%, a difference of 0.24%), Alaska Native (13.6%, a difference of 0.29%), and Delaware (13.5%, a difference of 0.55%).
| Demographics | Rating | Rank | Male Disability |
| French Canadians | 0.0 /100 | #305 | Tragic 13.3% |
| Spanish Americans | 0.0 /100 | #306 | Tragic 13.3% |
| Arapaho | 0.0 /100 | #307 | Tragic 13.3% |
| French American Indians | 0.0 /100 | #308 | Tragic 13.4% |
| Blackfeet | 0.0 /100 | #309 | Tragic 13.4% |
| Immigrants | Azores | 0.0 /100 | #310 | Tragic 13.4% |
| Delaware | 0.0 /100 | #311 | Tragic 13.5% |
| Yakama | 0.0 /100 | #312 | Tragic 13.5% |
| Puget Sound Salish | 0.0 /100 | #313 | Tragic 13.5% |
| Aleuts | 0.0 /100 | #314 | Tragic 13.5% |
| Iroquois | 0.0 /100 | #315 | Tragic 13.6% |
| Alaska Natives | 0.0 /100 | #316 | Tragic 13.6% |
| Paiute | 0.0 /100 | #317 | Tragic 13.7% |
| Cree | 0.0 /100 | #318 | Tragic 13.7% |
| Americans | 0.0 /100 | #319 | Tragic 13.8% |