Immigrants from Bolivia vs Yakama Male Disability
COMPARE
Immigrants from Bolivia
Yakama
Male Disability
Male Disability Comparison
Immigrants from Bolivia
Yakama
9.5%
MALE DISABILITY
100.0/ 100
METRIC RATING
7th/ 347
METRIC RANK
13.5%
MALE DISABILITY
0.0/ 100
METRIC RATING
312th/ 347
METRIC RANK
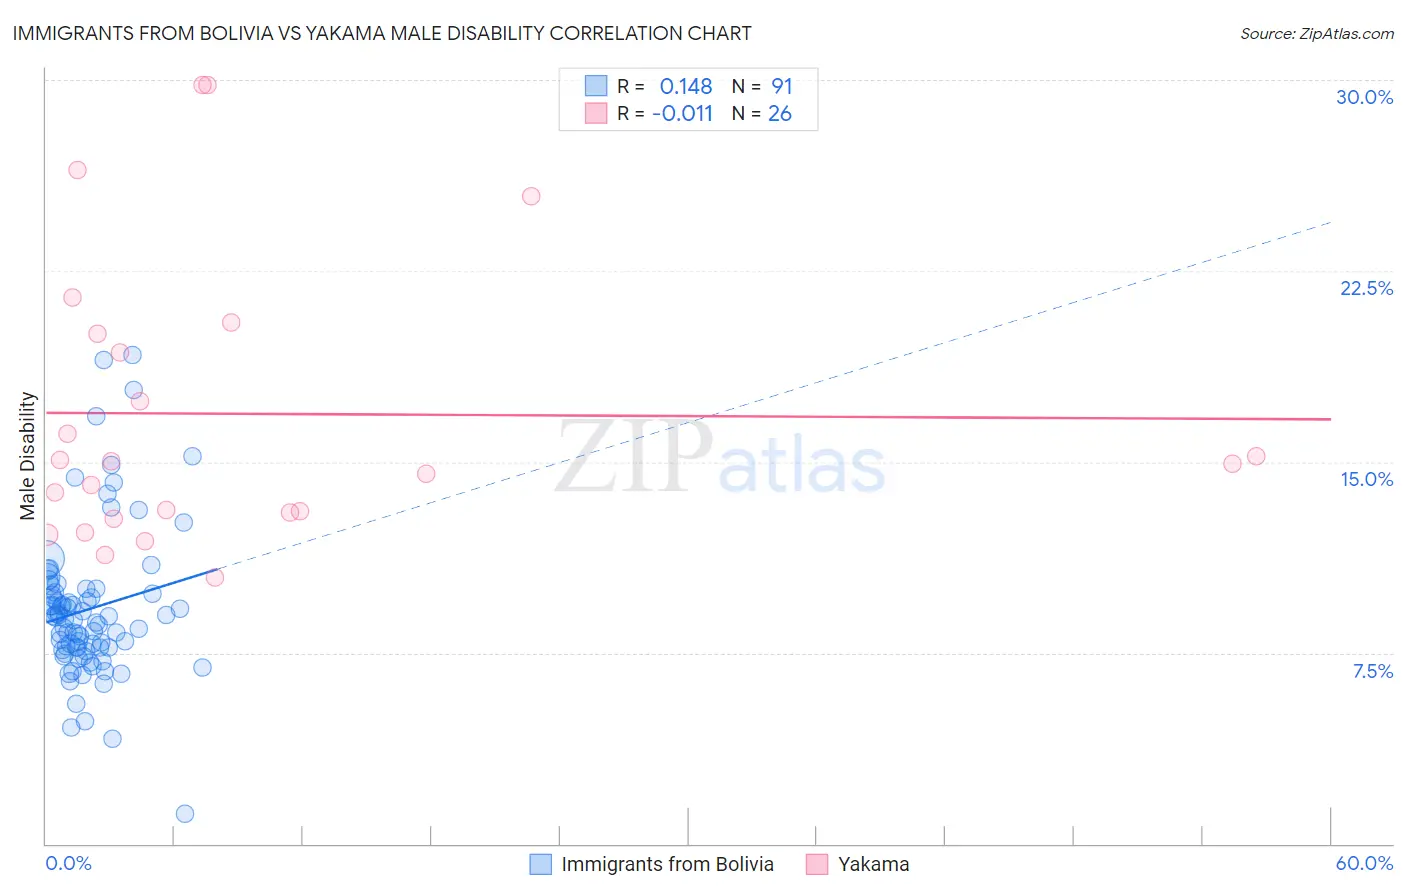
Immigrants from Bolivia vs Yakama Male Disability Correlation Chart
The statistical analysis conducted on geographies consisting of 158,713,247 people shows a poor positive correlation between the proportion of Immigrants from Bolivia and percentage of males with a disability in the United States with a correlation coefficient (R) of 0.148 and weighted average of 9.5%. Similarly, the statistical analysis conducted on geographies consisting of 19,917,759 people shows no correlation between the proportion of Yakama and percentage of males with a disability in the United States with a correlation coefficient (R) of -0.011 and weighted average of 13.5%, a difference of 43.1%.
Male Disability Correlation Summary
| Measurement | Immigrants from Bolivia | Yakama |
| Minimum | 1.2% | 10.5% |
| Maximum | 19.2% | 29.8% |
| Range | 18.0% | 19.4% |
| Mean | 9.2% | 16.9% |
| Median | 8.8% | 15.0% |
| Interquartile 25% (IQ1) | 7.7% | 13.0% |
| Interquartile 75% (IQ3) | 9.9% | 20.0% |
| Interquartile Range (IQR) | 2.2% | 7.0% |
| Standard Deviation (Sample) | 3.0% | 5.6% |
| Standard Deviation (Population) | 3.0% | 5.5% |
Similar Demographics by Male Disability
Demographics Similar to Immigrants from Bolivia by Male Disability
In terms of male disability, the demographic groups most similar to Immigrants from Bolivia are Immigrants from South Central Asia (9.4%, a difference of 0.33%), Immigrants from Hong Kong (9.4%, a difference of 0.39%), Immigrants from China (9.5%, a difference of 0.60%), Immigrants from Singapore (9.5%, a difference of 0.68%), and Immigrants from Israel (9.6%, a difference of 1.1%).
| Demographics | Rating | Rank | Male Disability |
| Immigrants | India | 100.0 /100 | #1 | Exceptional 9.0% |
| Immigrants | Taiwan | 100.0 /100 | #2 | Exceptional 9.1% |
| Filipinos | 100.0 /100 | #3 | Exceptional 9.1% |
| Thais | 100.0 /100 | #4 | Exceptional 9.2% |
| Immigrants | Hong Kong | 100.0 /100 | #5 | Exceptional 9.4% |
| Immigrants | South Central Asia | 100.0 /100 | #6 | Exceptional 9.4% |
| Immigrants | Bolivia | 100.0 /100 | #7 | Exceptional 9.5% |
| Immigrants | China | 100.0 /100 | #8 | Exceptional 9.5% |
| Immigrants | Singapore | 100.0 /100 | #9 | Exceptional 9.5% |
| Immigrants | Israel | 100.0 /100 | #10 | Exceptional 9.6% |
| Immigrants | Eastern Asia | 100.0 /100 | #11 | Exceptional 9.6% |
| Bolivians | 100.0 /100 | #12 | Exceptional 9.6% |
| Iranians | 100.0 /100 | #13 | Exceptional 9.7% |
| Immigrants | Iran | 100.0 /100 | #14 | Exceptional 9.7% |
| Indians (Asian) | 100.0 /100 | #15 | Exceptional 9.7% |
Demographics Similar to Yakama by Male Disability
In terms of male disability, the demographic groups most similar to Yakama are Puget Sound Salish (13.5%, a difference of 0.020%), Aleut (13.5%, a difference of 0.080%), Iroquois (13.6%, a difference of 0.24%), Alaska Native (13.6%, a difference of 0.29%), and Delaware (13.5%, a difference of 0.55%).
| Demographics | Rating | Rank | Male Disability |
| French Canadians | 0.0 /100 | #305 | Tragic 13.3% |
| Spanish Americans | 0.0 /100 | #306 | Tragic 13.3% |
| Arapaho | 0.0 /100 | #307 | Tragic 13.3% |
| French American Indians | 0.0 /100 | #308 | Tragic 13.4% |
| Blackfeet | 0.0 /100 | #309 | Tragic 13.4% |
| Immigrants | Azores | 0.0 /100 | #310 | Tragic 13.4% |
| Delaware | 0.0 /100 | #311 | Tragic 13.5% |
| Yakama | 0.0 /100 | #312 | Tragic 13.5% |
| Puget Sound Salish | 0.0 /100 | #313 | Tragic 13.5% |
| Aleuts | 0.0 /100 | #314 | Tragic 13.5% |
| Iroquois | 0.0 /100 | #315 | Tragic 13.6% |
| Alaska Natives | 0.0 /100 | #316 | Tragic 13.6% |
| Paiute | 0.0 /100 | #317 | Tragic 13.7% |
| Cree | 0.0 /100 | #318 | Tragic 13.7% |
| Americans | 0.0 /100 | #319 | Tragic 13.8% |