Cape Verdean vs Immigrants from Sierra Leone Male Disability
COMPARE
Cape Verdean
Immigrants from Sierra Leone
Male Disability
Male Disability Comparison
Cape Verdeans
Immigrants from Sierra Leone
12.8%
MALE DISABILITY
0.0/ 100
METRIC RATING
287th/ 347
METRIC RANK
10.5%
MALE DISABILITY
98.7/ 100
METRIC RATING
76th/ 347
METRIC RANK
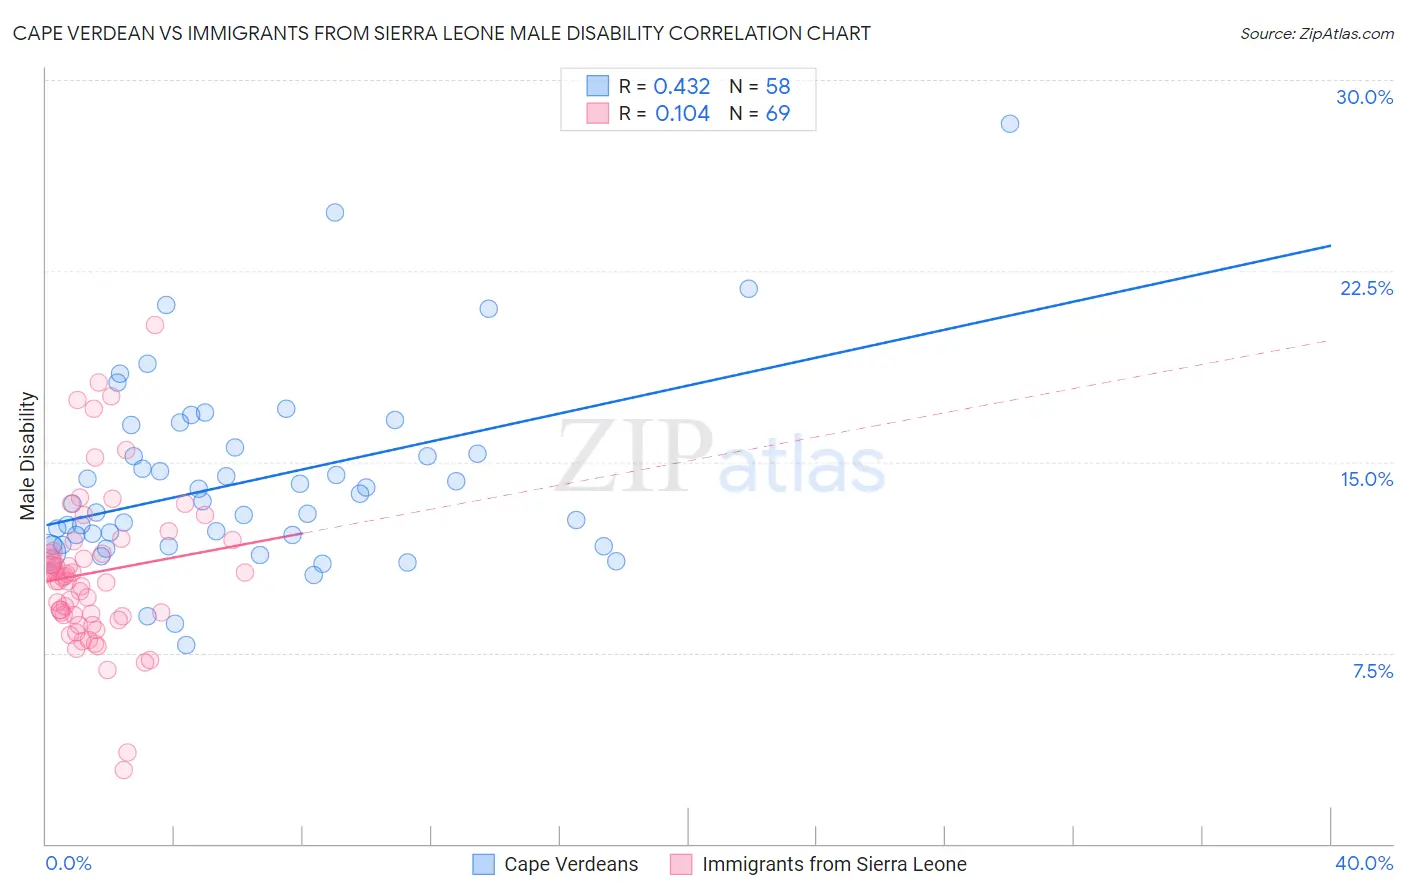
Cape Verdean vs Immigrants from Sierra Leone Male Disability Correlation Chart
The statistical analysis conducted on geographies consisting of 107,575,167 people shows a moderate positive correlation between the proportion of Cape Verdeans and percentage of males with a disability in the United States with a correlation coefficient (R) of 0.432 and weighted average of 12.8%. Similarly, the statistical analysis conducted on geographies consisting of 101,648,107 people shows a poor positive correlation between the proportion of Immigrants from Sierra Leone and percentage of males with a disability in the United States with a correlation coefficient (R) of 0.104 and weighted average of 10.5%, a difference of 21.0%.
Male Disability Correlation Summary
| Measurement | Cape Verdean | Immigrants from Sierra Leone |
| Minimum | 7.8% | 2.9% |
| Maximum | 28.3% | 20.4% |
| Range | 20.5% | 17.5% |
| Mean | 14.3% | 10.6% |
| Median | 13.4% | 10.4% |
| Interquartile 25% (IQ1) | 11.7% | 8.9% |
| Interquartile 75% (IQ3) | 15.6% | 11.7% |
| Interquartile Range (IQR) | 3.8% | 2.8% |
| Standard Deviation (Sample) | 3.7% | 3.0% |
| Standard Deviation (Population) | 3.7% | 3.0% |
Similar Demographics by Male Disability
Demographics Similar to Cape Verdeans by Male Disability
In terms of male disability, the demographic groups most similar to Cape Verdeans are Scottish (12.8%, a difference of 0.070%), Welsh (12.7%, a difference of 0.12%), Spanish (12.7%, a difference of 0.13%), Yup'ik (12.8%, a difference of 0.19%), and Immigrants from Cabo Verde (12.8%, a difference of 0.38%).
| Demographics | Rating | Rank | Male Disability |
| Dutch | 0.0 /100 | #280 | Tragic 12.7% |
| Sioux | 0.0 /100 | #281 | Tragic 12.7% |
| Irish | 0.0 /100 | #282 | Tragic 12.7% |
| Germans | 0.0 /100 | #283 | Tragic 12.7% |
| Spanish | 0.0 /100 | #284 | Tragic 12.7% |
| Welsh | 0.0 /100 | #285 | Tragic 12.7% |
| Scottish | 0.0 /100 | #286 | Tragic 12.8% |
| Cape Verdeans | 0.0 /100 | #287 | Tragic 12.8% |
| Yup'ik | 0.0 /100 | #288 | Tragic 12.8% |
| Immigrants | Cabo Verde | 0.0 /100 | #289 | Tragic 12.8% |
| Pima | 0.0 /100 | #290 | Tragic 12.8% |
| Whites/Caucasians | 0.0 /100 | #291 | Tragic 12.8% |
| English | 0.0 /100 | #292 | Tragic 12.8% |
| Yaqui | 0.0 /100 | #293 | Tragic 12.9% |
| Marshallese | 0.0 /100 | #294 | Tragic 12.9% |
Demographics Similar to Immigrants from Sierra Leone by Male Disability
In terms of male disability, the demographic groups most similar to Immigrants from Sierra Leone are Sierra Leonean (10.5%, a difference of 0.040%), Laotian (10.6%, a difference of 0.060%), Immigrants from Russia (10.6%, a difference of 0.080%), Immigrants from Lebanon (10.5%, a difference of 0.16%), and Immigrants from Lithuania (10.5%, a difference of 0.30%).
| Demographics | Rating | Rank | Male Disability |
| Ecuadorians | 99.2 /100 | #69 | Exceptional 10.5% |
| Immigrants | Bulgaria | 99.1 /100 | #70 | Exceptional 10.5% |
| Immigrants | Cameroon | 99.0 /100 | #71 | Exceptional 10.5% |
| Immigrants | Serbia | 99.0 /100 | #72 | Exceptional 10.5% |
| Immigrants | Lithuania | 98.9 /100 | #73 | Exceptional 10.5% |
| Immigrants | Lebanon | 98.8 /100 | #74 | Exceptional 10.5% |
| Sierra Leoneans | 98.7 /100 | #75 | Exceptional 10.5% |
| Immigrants | Sierra Leone | 98.7 /100 | #76 | Exceptional 10.5% |
| Laotians | 98.6 /100 | #77 | Exceptional 10.6% |
| Immigrants | Russia | 98.6 /100 | #78 | Exceptional 10.6% |
| Zimbabweans | 98.4 /100 | #79 | Exceptional 10.6% |
| Immigrants | Jordan | 98.4 /100 | #80 | Exceptional 10.6% |
| Immigrants | Chile | 98.3 /100 | #81 | Exceptional 10.6% |
| Immigrants | Guyana | 98.2 /100 | #82 | Exceptional 10.6% |
| Immigrants | Poland | 98.1 /100 | #83 | Exceptional 10.6% |