Tohono O'odham vs Yakama Male Disability
COMPARE
Tohono O'odham
Yakama
Male Disability
Male Disability Comparison
Tohono O'odham
Yakama
14.6%
MALE DISABILITY
0.0/ 100
METRIC RATING
331st/ 347
METRIC RANK
13.5%
MALE DISABILITY
0.0/ 100
METRIC RATING
312th/ 347
METRIC RANK
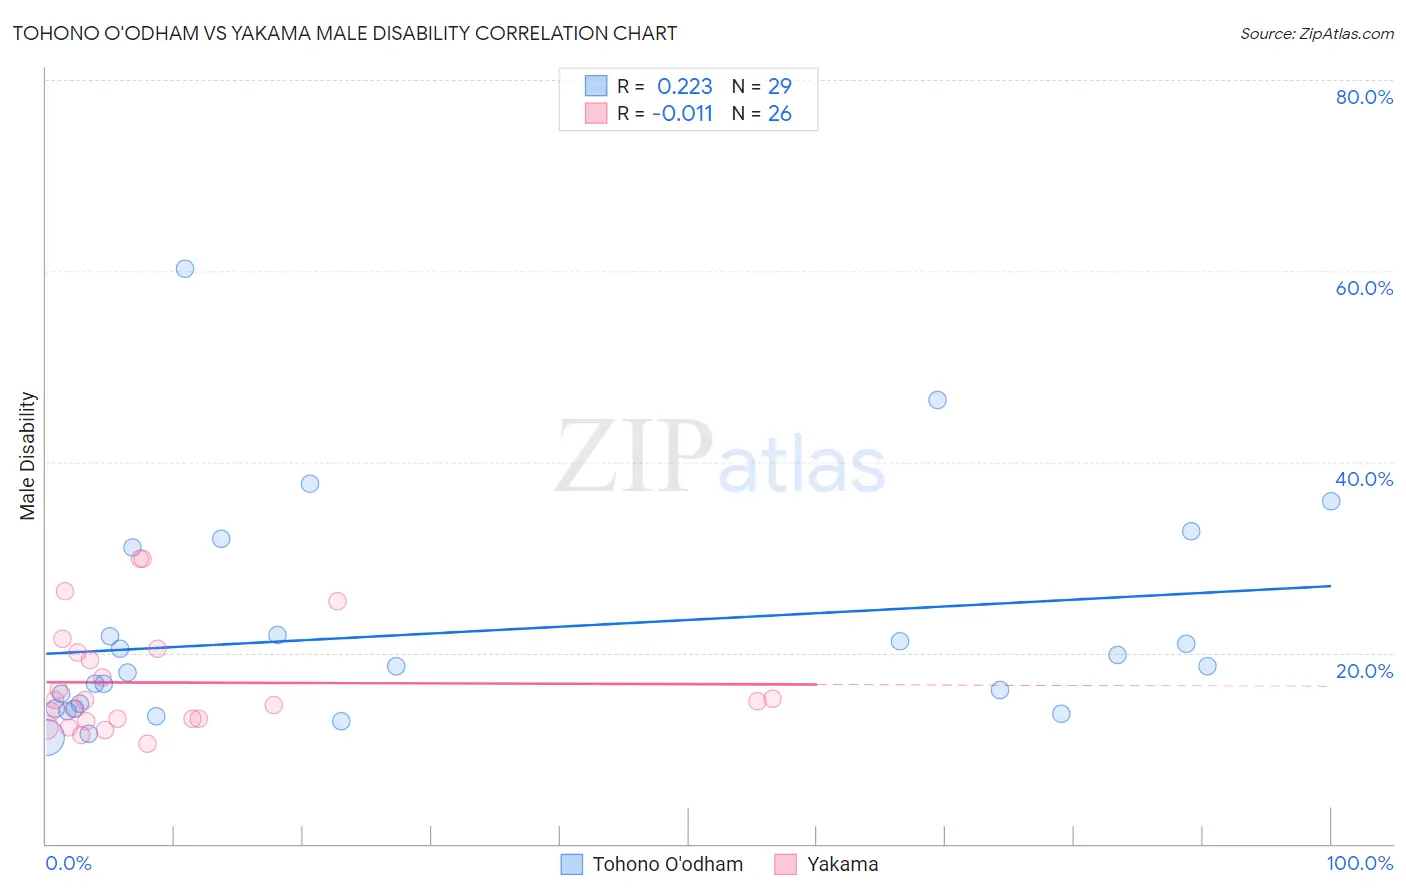
Tohono O'odham vs Yakama Male Disability Correlation Chart
The statistical analysis conducted on geographies consisting of 58,720,807 people shows a weak positive correlation between the proportion of Tohono O'odham and percentage of males with a disability in the United States with a correlation coefficient (R) of 0.223 and weighted average of 14.6%. Similarly, the statistical analysis conducted on geographies consisting of 19,917,759 people shows no correlation between the proportion of Yakama and percentage of males with a disability in the United States with a correlation coefficient (R) of -0.011 and weighted average of 13.5%, a difference of 7.9%.
Male Disability Correlation Summary
| Measurement | Tohono O'odham | Yakama |
| Minimum | 11.2% | 10.5% |
| Maximum | 60.2% | 29.8% |
| Range | 49.0% | 19.4% |
| Mean | 22.1% | 16.9% |
| Median | 18.6% | 15.0% |
| Interquartile 25% (IQ1) | 14.1% | 13.0% |
| Interquartile 75% (IQ3) | 26.4% | 20.0% |
| Interquartile Range (IQR) | 12.3% | 7.0% |
| Standard Deviation (Sample) | 11.4% | 5.6% |
| Standard Deviation (Population) | 11.2% | 5.5% |
Demographics Similar to Tohono O'odham and Yakama by Male Disability
In terms of male disability, the demographic groups most similar to Tohono O'odham are Navajo (14.4%, a difference of 1.5%), Cajun (14.4%, a difference of 1.7%), Chippewa (14.3%, a difference of 2.3%), Potawatomi (14.2%, a difference of 2.7%), and Native/Alaskan (14.2%, a difference of 2.9%). Similarly, the demographic groups most similar to Yakama are Puget Sound Salish (13.5%, a difference of 0.020%), Aleut (13.5%, a difference of 0.080%), Iroquois (13.6%, a difference of 0.24%), Alaska Native (13.6%, a difference of 0.29%), and Delaware (13.5%, a difference of 0.55%).
| Demographics | Rating | Rank | Male Disability |
| Delaware | 0.0 /100 | #311 | Tragic 13.5% |
| Yakama | 0.0 /100 | #312 | Tragic 13.5% |
| Puget Sound Salish | 0.0 /100 | #313 | Tragic 13.5% |
| Aleuts | 0.0 /100 | #314 | Tragic 13.5% |
| Iroquois | 0.0 /100 | #315 | Tragic 13.6% |
| Alaska Natives | 0.0 /100 | #316 | Tragic 13.6% |
| Paiute | 0.0 /100 | #317 | Tragic 13.7% |
| Cree | 0.0 /100 | #318 | Tragic 13.7% |
| Americans | 0.0 /100 | #319 | Tragic 13.8% |
| Tlingit-Haida | 0.0 /100 | #320 | Tragic 13.8% |
| Shoshone | 0.0 /100 | #321 | Tragic 13.8% |
| Apache | 0.0 /100 | #322 | Tragic 14.0% |
| Osage | 0.0 /100 | #323 | Tragic 14.0% |
| Comanche | 0.0 /100 | #324 | Tragic 14.1% |
| Ottawa | 0.0 /100 | #325 | Tragic 14.1% |
| Natives/Alaskans | 0.0 /100 | #326 | Tragic 14.2% |
| Potawatomi | 0.0 /100 | #327 | Tragic 14.2% |
| Chippewa | 0.0 /100 | #328 | Tragic 14.3% |
| Cajuns | 0.0 /100 | #329 | Tragic 14.4% |
| Navajo | 0.0 /100 | #330 | Tragic 14.4% |
| Tohono O'odham | 0.0 /100 | #331 | Tragic 14.6% |