Immigrants from Eastern Africa vs Yakama Male Disability
COMPARE
Immigrants from Eastern Africa
Yakama
Male Disability
Male Disability Comparison
Immigrants from Eastern Africa
Yakama
10.8%
MALE DISABILITY
94.3/ 100
METRIC RATING
107th/ 347
METRIC RANK
13.5%
MALE DISABILITY
0.0/ 100
METRIC RATING
312th/ 347
METRIC RANK
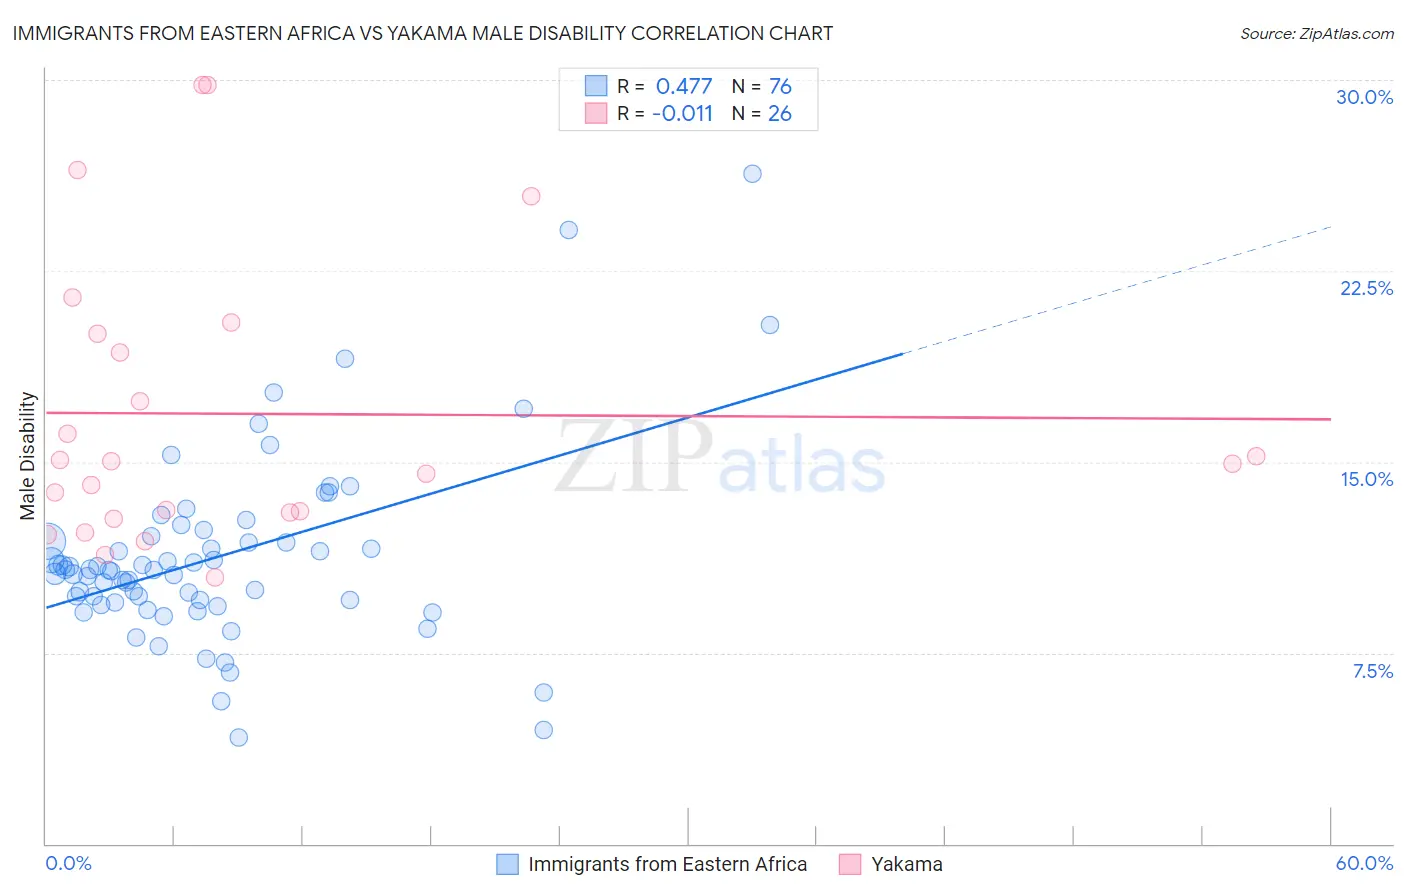
Immigrants from Eastern Africa vs Yakama Male Disability Correlation Chart
The statistical analysis conducted on geographies consisting of 355,104,040 people shows a moderate positive correlation between the proportion of Immigrants from Eastern Africa and percentage of males with a disability in the United States with a correlation coefficient (R) of 0.477 and weighted average of 10.8%. Similarly, the statistical analysis conducted on geographies consisting of 19,917,759 people shows no correlation between the proportion of Yakama and percentage of males with a disability in the United States with a correlation coefficient (R) of -0.011 and weighted average of 13.5%, a difference of 25.6%.
Male Disability Correlation Summary
| Measurement | Immigrants from Eastern Africa | Yakama |
| Minimum | 4.2% | 10.5% |
| Maximum | 26.3% | 29.8% |
| Range | 22.2% | 19.4% |
| Mean | 11.3% | 16.9% |
| Median | 10.8% | 15.0% |
| Interquartile 25% (IQ1) | 9.5% | 13.0% |
| Interquartile 75% (IQ3) | 12.0% | 20.0% |
| Interquartile Range (IQR) | 2.5% | 7.0% |
| Standard Deviation (Sample) | 3.7% | 5.6% |
| Standard Deviation (Population) | 3.7% | 5.5% |
Similar Demographics by Male Disability
Demographics Similar to Immigrants from Eastern Africa by Male Disability
In terms of male disability, the demographic groups most similar to Immigrants from Eastern Africa are Immigrants from Belgium (10.8%, a difference of 0.020%), Immigrants from Uganda (10.8%, a difference of 0.070%), Immigrants (10.8%, a difference of 0.090%), Immigrants from Uruguay (10.8%, a difference of 0.13%), and Immigrants from Syria (10.8%, a difference of 0.18%).
| Demographics | Rating | Rank | Male Disability |
| Immigrants | Kazakhstan | 95.9 /100 | #100 | Exceptional 10.7% |
| Immigrants | Greece | 95.6 /100 | #101 | Exceptional 10.7% |
| Immigrants | Eastern Europe | 95.3 /100 | #102 | Exceptional 10.7% |
| Uruguayans | 95.3 /100 | #103 | Exceptional 10.7% |
| Immigrants | Nigeria | 95.1 /100 | #104 | Exceptional 10.8% |
| Immigrants | Brazil | 95.0 /100 | #105 | Exceptional 10.8% |
| Immigrants | Syria | 94.9 /100 | #106 | Exceptional 10.8% |
| Immigrants | Eastern Africa | 94.3 /100 | #107 | Exceptional 10.8% |
| Immigrants | Belgium | 94.2 /100 | #108 | Exceptional 10.8% |
| Immigrants | Uganda | 94.0 /100 | #109 | Exceptional 10.8% |
| Immigrants | Immigrants | 93.9 /100 | #110 | Exceptional 10.8% |
| Immigrants | Uruguay | 93.8 /100 | #111 | Exceptional 10.8% |
| Ghanaians | 93.4 /100 | #112 | Exceptional 10.8% |
| Immigrants | Zimbabwe | 93.0 /100 | #113 | Exceptional 10.8% |
| Central Americans | 92.7 /100 | #114 | Exceptional 10.8% |
Demographics Similar to Yakama by Male Disability
In terms of male disability, the demographic groups most similar to Yakama are Puget Sound Salish (13.5%, a difference of 0.020%), Aleut (13.5%, a difference of 0.080%), Iroquois (13.6%, a difference of 0.24%), Alaska Native (13.6%, a difference of 0.29%), and Delaware (13.5%, a difference of 0.55%).
| Demographics | Rating | Rank | Male Disability |
| French Canadians | 0.0 /100 | #305 | Tragic 13.3% |
| Spanish Americans | 0.0 /100 | #306 | Tragic 13.3% |
| Arapaho | 0.0 /100 | #307 | Tragic 13.3% |
| French American Indians | 0.0 /100 | #308 | Tragic 13.4% |
| Blackfeet | 0.0 /100 | #309 | Tragic 13.4% |
| Immigrants | Azores | 0.0 /100 | #310 | Tragic 13.4% |
| Delaware | 0.0 /100 | #311 | Tragic 13.5% |
| Yakama | 0.0 /100 | #312 | Tragic 13.5% |
| Puget Sound Salish | 0.0 /100 | #313 | Tragic 13.5% |
| Aleuts | 0.0 /100 | #314 | Tragic 13.5% |
| Iroquois | 0.0 /100 | #315 | Tragic 13.6% |
| Alaska Natives | 0.0 /100 | #316 | Tragic 13.6% |
| Paiute | 0.0 /100 | #317 | Tragic 13.7% |
| Cree | 0.0 /100 | #318 | Tragic 13.7% |
| Americans | 0.0 /100 | #319 | Tragic 13.8% |