Bahamian vs Yakama Male Disability
COMPARE
Bahamian
Yakama
Male Disability
Male Disability Comparison
Bahamians
Yakama
11.9%
MALE DISABILITY
1.1/ 100
METRIC RATING
241st/ 347
METRIC RANK
13.5%
MALE DISABILITY
0.0/ 100
METRIC RATING
312th/ 347
METRIC RANK
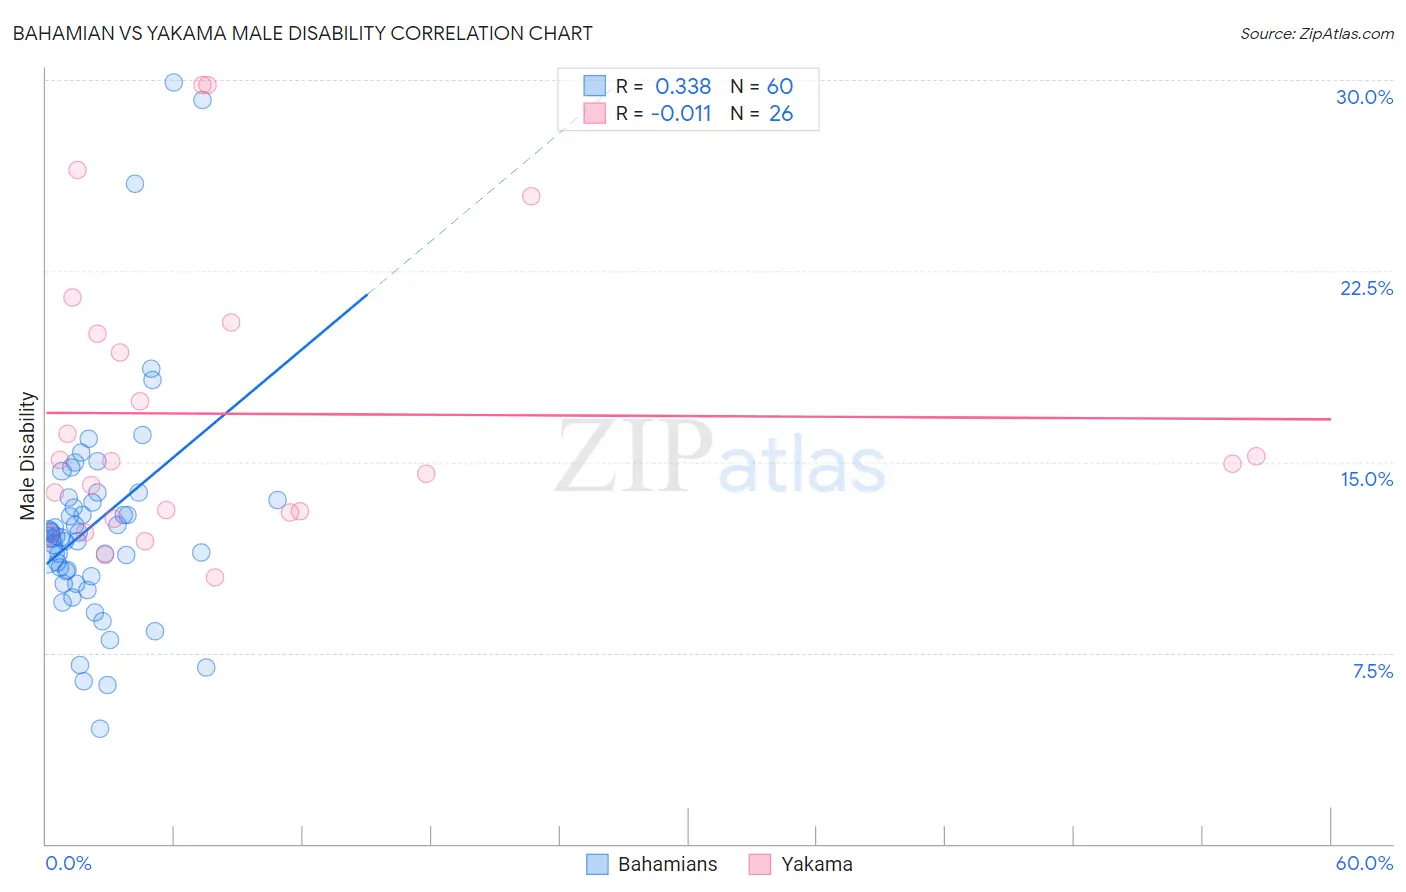
Bahamian vs Yakama Male Disability Correlation Chart
The statistical analysis conducted on geographies consisting of 112,681,735 people shows a mild positive correlation between the proportion of Bahamians and percentage of males with a disability in the United States with a correlation coefficient (R) of 0.338 and weighted average of 11.9%. Similarly, the statistical analysis conducted on geographies consisting of 19,917,759 people shows no correlation between the proportion of Yakama and percentage of males with a disability in the United States with a correlation coefficient (R) of -0.011 and weighted average of 13.5%, a difference of 13.6%.
Male Disability Correlation Summary
| Measurement | Bahamian | Yakama |
| Minimum | 4.5% | 10.5% |
| Maximum | 29.9% | 29.8% |
| Range | 25.4% | 19.4% |
| Mean | 12.6% | 16.9% |
| Median | 12.1% | 15.0% |
| Interquartile 25% (IQ1) | 10.6% | 13.0% |
| Interquartile 75% (IQ3) | 13.5% | 20.0% |
| Interquartile Range (IQR) | 2.9% | 7.0% |
| Standard Deviation (Sample) | 4.5% | 5.6% |
| Standard Deviation (Population) | 4.5% | 5.5% |
Similar Demographics by Male Disability
Demographics Similar to Bahamians by Male Disability
In terms of male disability, the demographic groups most similar to Bahamians are Northern European (11.9%, a difference of 0.010%), Czech (11.9%, a difference of 0.040%), Samoan (11.9%, a difference of 0.040%), Italian (11.9%, a difference of 0.080%), and Yugoslavian (11.9%, a difference of 0.14%).
| Demographics | Rating | Rank | Male Disability |
| Immigrants | Canada | 1.6 /100 | #234 | Tragic 11.9% |
| Immigrants | North America | 1.5 /100 | #235 | Tragic 11.9% |
| U.S. Virgin Islanders | 1.3 /100 | #236 | Tragic 11.9% |
| Carpatho Rusyns | 1.3 /100 | #237 | Tragic 11.9% |
| Yugoslavians | 1.2 /100 | #238 | Tragic 11.9% |
| Italians | 1.2 /100 | #239 | Tragic 11.9% |
| Czechs | 1.1 /100 | #240 | Tragic 11.9% |
| Bahamians | 1.1 /100 | #241 | Tragic 11.9% |
| Northern Europeans | 1.1 /100 | #242 | Tragic 11.9% |
| Samoans | 1.1 /100 | #243 | Tragic 11.9% |
| Immigrants | Laos | 1.0 /100 | #244 | Tragic 11.9% |
| Immigrants | Liberia | 1.0 /100 | #245 | Tragic 11.9% |
| Danes | 0.9 /100 | #246 | Tragic 11.9% |
| Hungarians | 0.8 /100 | #247 | Tragic 12.0% |
| Poles | 0.7 /100 | #248 | Tragic 12.0% |
Demographics Similar to Yakama by Male Disability
In terms of male disability, the demographic groups most similar to Yakama are Puget Sound Salish (13.5%, a difference of 0.020%), Aleut (13.5%, a difference of 0.080%), Iroquois (13.6%, a difference of 0.24%), Alaska Native (13.6%, a difference of 0.29%), and Delaware (13.5%, a difference of 0.55%).
| Demographics | Rating | Rank | Male Disability |
| French Canadians | 0.0 /100 | #305 | Tragic 13.3% |
| Spanish Americans | 0.0 /100 | #306 | Tragic 13.3% |
| Arapaho | 0.0 /100 | #307 | Tragic 13.3% |
| French American Indians | 0.0 /100 | #308 | Tragic 13.4% |
| Blackfeet | 0.0 /100 | #309 | Tragic 13.4% |
| Immigrants | Azores | 0.0 /100 | #310 | Tragic 13.4% |
| Delaware | 0.0 /100 | #311 | Tragic 13.5% |
| Yakama | 0.0 /100 | #312 | Tragic 13.5% |
| Puget Sound Salish | 0.0 /100 | #313 | Tragic 13.5% |
| Aleuts | 0.0 /100 | #314 | Tragic 13.5% |
| Iroquois | 0.0 /100 | #315 | Tragic 13.6% |
| Alaska Natives | 0.0 /100 | #316 | Tragic 13.6% |
| Paiute | 0.0 /100 | #317 | Tragic 13.7% |
| Cree | 0.0 /100 | #318 | Tragic 13.7% |
| Americans | 0.0 /100 | #319 | Tragic 13.8% |