Immigrants from Africa vs Yakama Male Disability
COMPARE
Immigrants from Africa
Yakama
Male Disability
Male Disability Comparison
Immigrants from Africa
Yakama
10.9%
MALE DISABILITY
89.4/ 100
METRIC RATING
120th/ 347
METRIC RANK
13.5%
MALE DISABILITY
0.0/ 100
METRIC RATING
312th/ 347
METRIC RANK
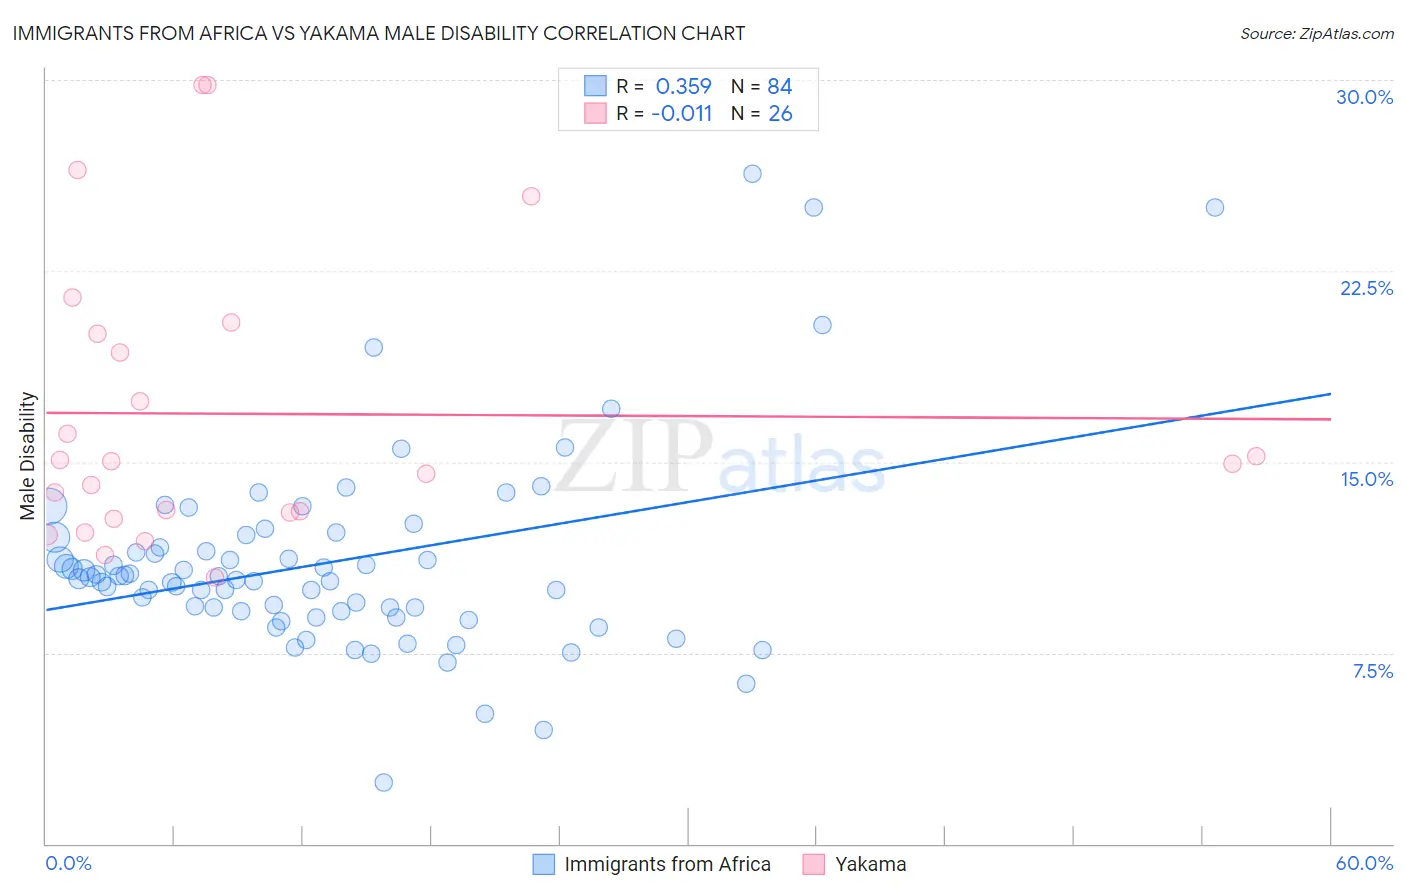
Immigrants from Africa vs Yakama Male Disability Correlation Chart
The statistical analysis conducted on geographies consisting of 469,296,283 people shows a mild positive correlation between the proportion of Immigrants from Africa and percentage of males with a disability in the United States with a correlation coefficient (R) of 0.359 and weighted average of 10.9%. Similarly, the statistical analysis conducted on geographies consisting of 19,917,759 people shows no correlation between the proportion of Yakama and percentage of males with a disability in the United States with a correlation coefficient (R) of -0.011 and weighted average of 13.5%, a difference of 24.4%.
Male Disability Correlation Summary
| Measurement | Immigrants from Africa | Yakama |
| Minimum | 2.4% | 10.5% |
| Maximum | 26.3% | 29.8% |
| Range | 23.9% | 19.4% |
| Mean | 11.0% | 16.9% |
| Median | 10.4% | 15.0% |
| Interquartile 25% (IQ1) | 9.1% | 13.0% |
| Interquartile 75% (IQ3) | 11.8% | 20.0% |
| Interquartile Range (IQR) | 2.7% | 7.0% |
| Standard Deviation (Sample) | 3.9% | 5.6% |
| Standard Deviation (Population) | 3.9% | 5.5% |
Similar Demographics by Male Disability
Demographics Similar to Immigrants from Africa by Male Disability
In terms of male disability, the demographic groups most similar to Immigrants from Africa are Immigrants from South Eastern Asia (10.9%, a difference of 0.040%), Immigrants from Ghana (10.9%, a difference of 0.060%), Immigrants from Cuba (10.9%, a difference of 0.11%), Armenian (10.9%, a difference of 0.11%), and Immigrants from Czechoslovakia (10.9%, a difference of 0.15%).
| Demographics | Rating | Rank | Male Disability |
| Immigrants | Zimbabwe | 93.0 /100 | #113 | Exceptional 10.8% |
| Central Americans | 92.7 /100 | #114 | Exceptional 10.8% |
| Immigrants | Barbados | 92.2 /100 | #115 | Exceptional 10.8% |
| Immigrants | South Africa | 91.8 /100 | #116 | Exceptional 10.8% |
| Eastern Europeans | 90.6 /100 | #117 | Exceptional 10.9% |
| Immigrants | Cuba | 90.2 /100 | #118 | Exceptional 10.9% |
| Armenians | 90.1 /100 | #119 | Exceptional 10.9% |
| Immigrants | Africa | 89.4 /100 | #120 | Excellent 10.9% |
| Immigrants | South Eastern Asia | 89.2 /100 | #121 | Excellent 10.9% |
| Immigrants | Ghana | 89.0 /100 | #122 | Excellent 10.9% |
| Immigrants | Czechoslovakia | 88.4 /100 | #123 | Excellent 10.9% |
| South American Indians | 88.1 /100 | #124 | Excellent 10.9% |
| Immigrants | North Macedonia | 88.1 /100 | #125 | Excellent 10.9% |
| Immigrants | Trinidad and Tobago | 86.9 /100 | #126 | Excellent 10.9% |
| Immigrants | Ukraine | 86.8 /100 | #127 | Excellent 10.9% |
Demographics Similar to Yakama by Male Disability
In terms of male disability, the demographic groups most similar to Yakama are Puget Sound Salish (13.5%, a difference of 0.020%), Aleut (13.5%, a difference of 0.080%), Iroquois (13.6%, a difference of 0.24%), Alaska Native (13.6%, a difference of 0.29%), and Delaware (13.5%, a difference of 0.55%).
| Demographics | Rating | Rank | Male Disability |
| French Canadians | 0.0 /100 | #305 | Tragic 13.3% |
| Spanish Americans | 0.0 /100 | #306 | Tragic 13.3% |
| Arapaho | 0.0 /100 | #307 | Tragic 13.3% |
| French American Indians | 0.0 /100 | #308 | Tragic 13.4% |
| Blackfeet | 0.0 /100 | #309 | Tragic 13.4% |
| Immigrants | Azores | 0.0 /100 | #310 | Tragic 13.4% |
| Delaware | 0.0 /100 | #311 | Tragic 13.5% |
| Yakama | 0.0 /100 | #312 | Tragic 13.5% |
| Puget Sound Salish | 0.0 /100 | #313 | Tragic 13.5% |
| Aleuts | 0.0 /100 | #314 | Tragic 13.5% |
| Iroquois | 0.0 /100 | #315 | Tragic 13.6% |
| Alaska Natives | 0.0 /100 | #316 | Tragic 13.6% |
| Paiute | 0.0 /100 | #317 | Tragic 13.7% |
| Cree | 0.0 /100 | #318 | Tragic 13.7% |
| Americans | 0.0 /100 | #319 | Tragic 13.8% |