Canadian vs Inupiat Ambulatory Disability
COMPARE
Canadian
Inupiat
Ambulatory Disability
Ambulatory Disability Comparison
Canadians
Inupiat
6.3%
AMBULATORY DISABILITY
10.9/ 100
METRIC RATING
216th/ 347
METRIC RANK
5.6%
AMBULATORY DISABILITY
99.8/ 100
METRIC RATING
56th/ 347
METRIC RANK
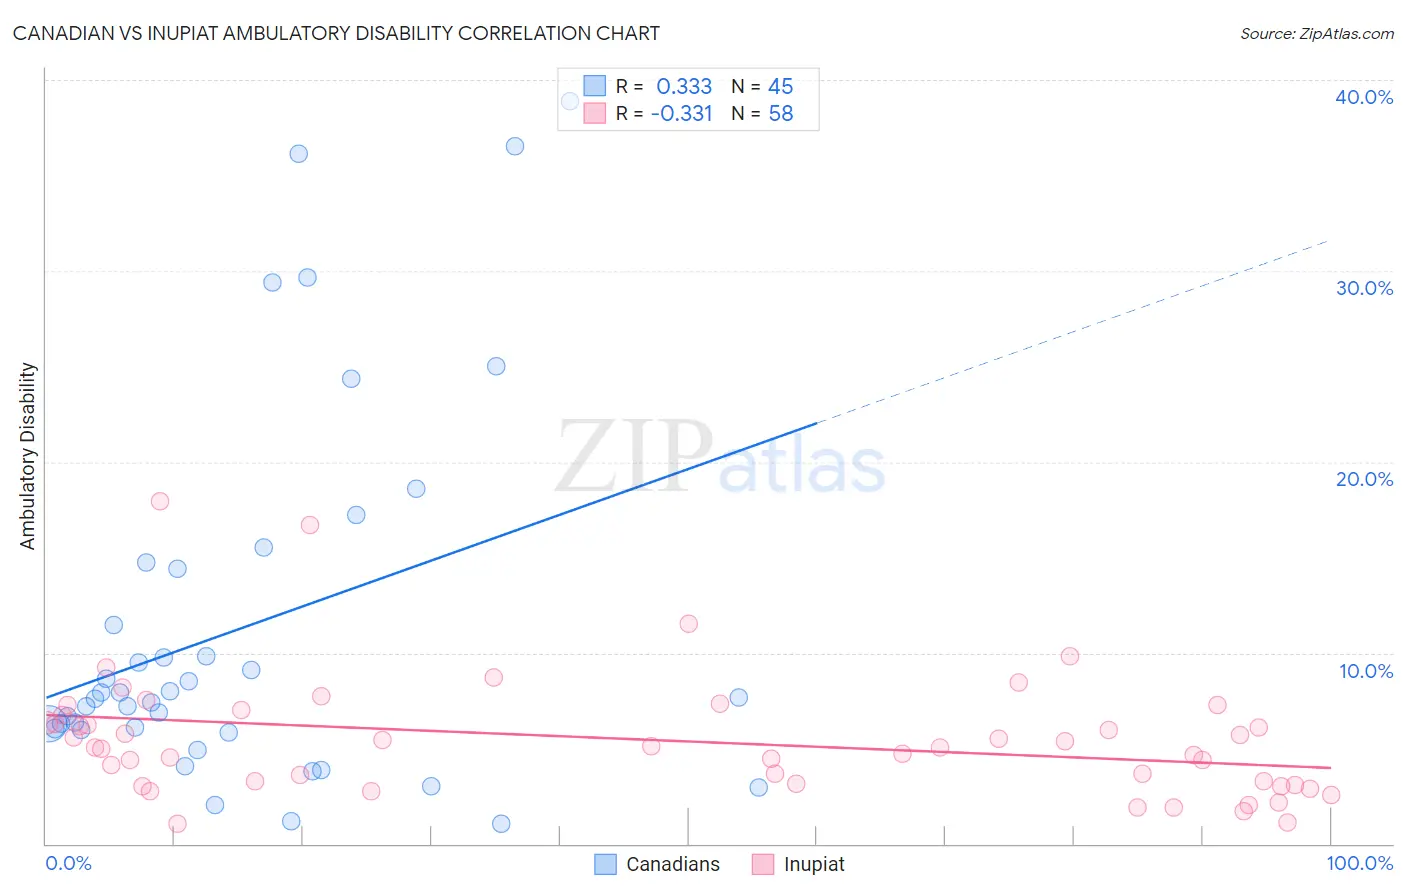
Canadian vs Inupiat Ambulatory Disability Correlation Chart
The statistical analysis conducted on geographies consisting of 437,391,973 people shows a mild positive correlation between the proportion of Canadians and percentage of population with ambulatory disability in the United States with a correlation coefficient (R) of 0.333 and weighted average of 6.3%. Similarly, the statistical analysis conducted on geographies consisting of 96,327,130 people shows a mild negative correlation between the proportion of Inupiat and percentage of population with ambulatory disability in the United States with a correlation coefficient (R) of -0.331 and weighted average of 5.6%, a difference of 12.1%.
Ambulatory Disability Correlation Summary
| Measurement | Canadian | Inupiat |
| Minimum | 1.0% | 1.1% |
| Maximum | 38.9% | 18.0% |
| Range | 37.8% | 16.9% |
| Mean | 11.4% | 5.4% |
| Median | 7.7% | 5.0% |
| Interquartile 25% (IQ1) | 6.0% | 3.1% |
| Interquartile 75% (IQ3) | 14.6% | 6.8% |
| Interquartile Range (IQR) | 8.6% | 3.7% |
| Standard Deviation (Sample) | 9.7% | 3.2% |
| Standard Deviation (Population) | 9.6% | 3.2% |
Similar Demographics by Ambulatory Disability
Demographics Similar to Canadians by Ambulatory Disability
In terms of ambulatory disability, the demographic groups most similar to Canadians are Yugoslavian (6.3%, a difference of 0.0%), Immigrants from Latin America (6.3%, a difference of 0.010%), Immigrants from Mexico (6.3%, a difference of 0.020%), Guamanian/Chamorro (6.3%, a difference of 0.040%), and Mexican American Indian (6.3%, a difference of 0.14%).
| Demographics | Rating | Rank | Ambulatory Disability |
| Immigrants | Iraq | 14.0 /100 | #209 | Poor 6.3% |
| Immigrants | Laos | 13.2 /100 | #210 | Poor 6.3% |
| Samoans | 12.1 /100 | #211 | Poor 6.3% |
| Mexican American Indians | 12.0 /100 | #212 | Poor 6.3% |
| Japanese | 12.0 /100 | #213 | Poor 6.3% |
| Immigrants | Mexico | 11.0 /100 | #214 | Poor 6.3% |
| Immigrants | Latin America | 11.0 /100 | #215 | Poor 6.3% |
| Canadians | 10.9 /100 | #216 | Poor 6.3% |
| Yugoslavians | 10.9 /100 | #217 | Poor 6.3% |
| Guamanians/Chamorros | 10.6 /100 | #218 | Poor 6.3% |
| Indonesians | 9.9 /100 | #219 | Tragic 6.3% |
| Immigrants | Albania | 9.6 /100 | #220 | Tragic 6.3% |
| Hungarians | 9.6 /100 | #221 | Tragic 6.3% |
| German Russians | 9.4 /100 | #222 | Tragic 6.3% |
| Immigrants | Honduras | 7.6 /100 | #223 | Tragic 6.3% |
Demographics Similar to Inupiat by Ambulatory Disability
In terms of ambulatory disability, the demographic groups most similar to Inupiat are Immigrants from Bulgaria (5.6%, a difference of 0.090%), Immigrants from Eastern Africa (5.6%, a difference of 0.16%), Immigrants from Egypt (5.6%, a difference of 0.20%), Jordanian (5.6%, a difference of 0.21%), and Immigrants from Brazil (5.6%, a difference of 0.24%).
| Demographics | Rating | Rank | Ambulatory Disability |
| Bulgarians | 99.9 /100 | #49 | Exceptional 5.6% |
| Luxembourgers | 99.9 /100 | #50 | Exceptional 5.6% |
| Taiwanese | 99.8 /100 | #51 | Exceptional 5.6% |
| Jordanians | 99.8 /100 | #52 | Exceptional 5.6% |
| Immigrants | Egypt | 99.8 /100 | #53 | Exceptional 5.6% |
| Immigrants | Eastern Africa | 99.8 /100 | #54 | Exceptional 5.6% |
| Immigrants | Bulgaria | 99.8 /100 | #55 | Exceptional 5.6% |
| Inupiat | 99.8 /100 | #56 | Exceptional 5.6% |
| Immigrants | Brazil | 99.8 /100 | #57 | Exceptional 5.6% |
| Immigrants | Zimbabwe | 99.8 /100 | #58 | Exceptional 5.6% |
| Immigrants | Afghanistan | 99.8 /100 | #59 | Exceptional 5.6% |
| Immigrants | Lithuania | 99.8 /100 | #60 | Exceptional 5.6% |
| Immigrants | Belgium | 99.7 /100 | #61 | Exceptional 5.6% |
| Immigrants | Spain | 99.7 /100 | #62 | Exceptional 5.6% |
| Immigrants | France | 99.7 /100 | #63 | Exceptional 5.6% |