Canadian vs Trinidadian and Tobagonian Disability
COMPARE
Canadian
Trinidadian and Tobagonian
Disability
Disability Comparison
Canadians
Trinidadians and Tobagonians
12.4%
DISABILITY
0.4/ 100
METRIC RATING
259th/ 347
METRIC RANK
11.7%
DISABILITY
52.7/ 100
METRIC RATING
172nd/ 347
METRIC RANK
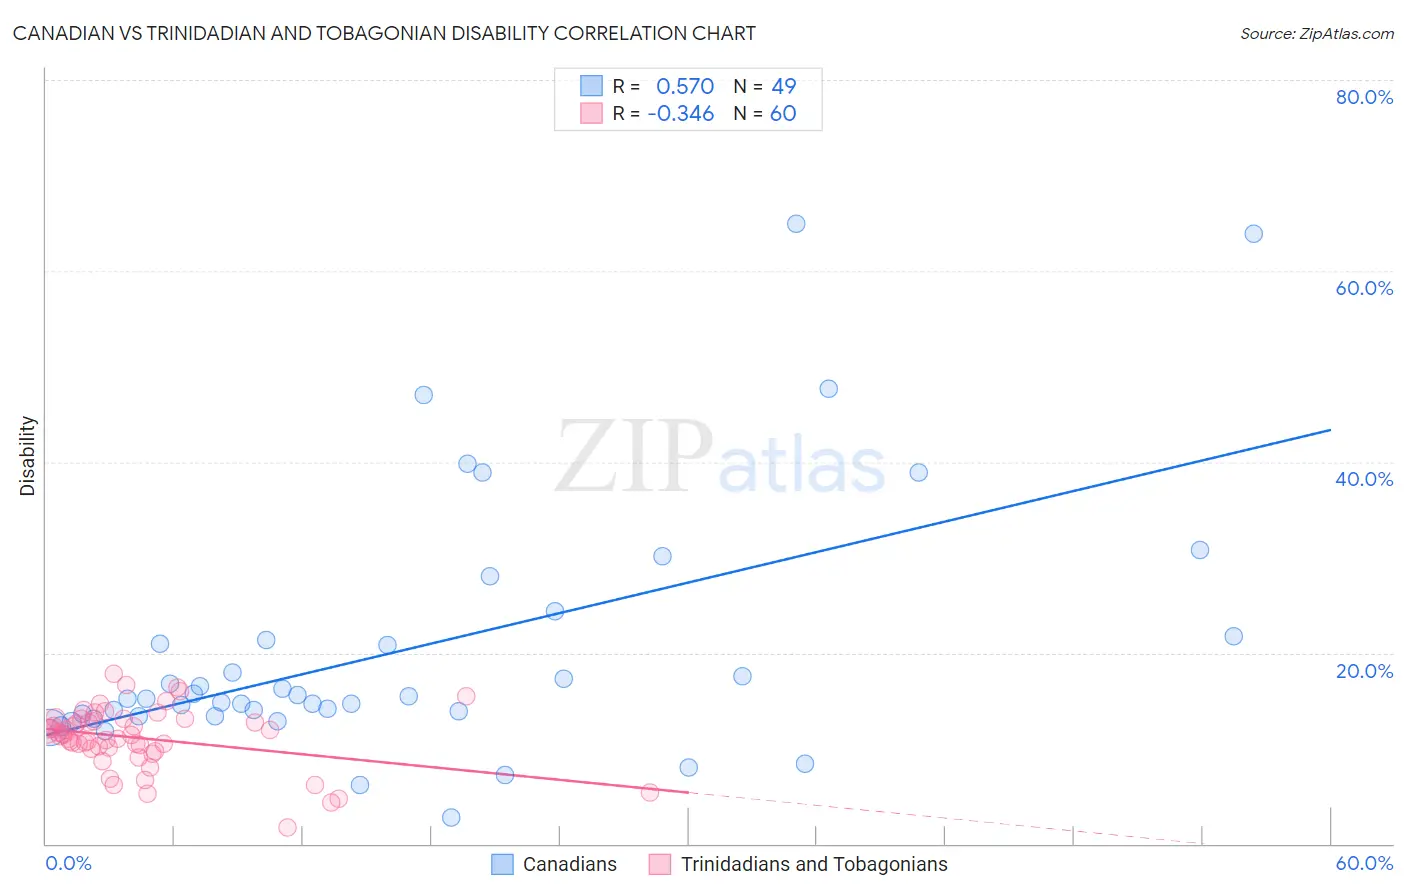
Canadian vs Trinidadian and Tobagonian Disability Correlation Chart
The statistical analysis conducted on geographies consisting of 437,501,505 people shows a substantial positive correlation between the proportion of Canadians and percentage of population with a disability in the United States with a correlation coefficient (R) of 0.570 and weighted average of 12.4%. Similarly, the statistical analysis conducted on geographies consisting of 219,849,540 people shows a mild negative correlation between the proportion of Trinidadians and Tobagonians and percentage of population with a disability in the United States with a correlation coefficient (R) of -0.346 and weighted average of 11.7%, a difference of 6.1%.
Disability Correlation Summary
| Measurement | Canadian | Trinidadian and Tobagonian |
| Minimum | 2.8% | 1.7% |
| Maximum | 65.0% | 17.7% |
| Range | 62.2% | 16.0% |
| Mean | 20.3% | 11.1% |
| Median | 15.2% | 11.4% |
| Interquartile 25% (IQ1) | 13.4% | 10.0% |
| Interquartile 75% (IQ3) | 21.6% | 13.0% |
| Interquartile Range (IQR) | 8.2% | 2.9% |
| Standard Deviation (Sample) | 13.5% | 3.2% |
| Standard Deviation (Population) | 13.3% | 3.2% |
Similar Demographics by Disability
Demographics Similar to Canadians by Disability
In terms of disability, the demographic groups most similar to Canadians are Immigrants from Liberia (12.4%, a difference of 0.030%), Slavic (12.4%, a difference of 0.060%), Scandinavian (12.4%, a difference of 0.10%), Immigrants from Laos (12.4%, a difference of 0.20%), and Immigrants from Dominica (12.4%, a difference of 0.29%).
| Demographics | Rating | Rank | Disability |
| Bermudans | 1.1 /100 | #252 | Tragic 12.3% |
| Belgians | 0.8 /100 | #253 | Tragic 12.3% |
| German Russians | 0.8 /100 | #254 | Tragic 12.3% |
| Slovenes | 0.6 /100 | #255 | Tragic 12.4% |
| Immigrants | Dominica | 0.6 /100 | #256 | Tragic 12.4% |
| Immigrants | Laos | 0.5 /100 | #257 | Tragic 12.4% |
| Slavs | 0.5 /100 | #258 | Tragic 12.4% |
| Canadians | 0.4 /100 | #259 | Tragic 12.4% |
| Immigrants | Liberia | 0.4 /100 | #260 | Tragic 12.4% |
| Scandinavians | 0.4 /100 | #261 | Tragic 12.4% |
| Native Hawaiians | 0.3 /100 | #262 | Tragic 12.5% |
| Hawaiians | 0.2 /100 | #263 | Tragic 12.5% |
| Immigrants | Germany | 0.2 /100 | #264 | Tragic 12.5% |
| U.S. Virgin Islanders | 0.2 /100 | #265 | Tragic 12.5% |
| Czechoslovakians | 0.2 /100 | #266 | Tragic 12.5% |
Demographics Similar to Trinidadians and Tobagonians by Disability
In terms of disability, the demographic groups most similar to Trinidadians and Tobagonians are Immigrants from Albania (11.7%, a difference of 0.010%), Immigrants from Southern Europe (11.7%, a difference of 0.010%), Immigrants from Austria (11.7%, a difference of 0.030%), Immigrants from Latin America (11.7%, a difference of 0.060%), and Estonian (11.7%, a difference of 0.080%).
| Demographics | Rating | Rank | Disability |
| Cubans | 56.7 /100 | #165 | Average 11.7% |
| Pakistanis | 54.7 /100 | #166 | Average 11.7% |
| Estonians | 54.4 /100 | #167 | Average 11.7% |
| Immigrants | Latin America | 54.1 /100 | #168 | Average 11.7% |
| Immigrants | Austria | 53.4 /100 | #169 | Average 11.7% |
| Immigrants | Albania | 52.8 /100 | #170 | Average 11.7% |
| Immigrants | Southern Europe | 52.8 /100 | #171 | Average 11.7% |
| Trinidadians and Tobagonians | 52.7 /100 | #172 | Average 11.7% |
| Maltese | 50.6 /100 | #173 | Average 11.7% |
| Albanians | 50.0 /100 | #174 | Average 11.7% |
| Haitians | 48.6 /100 | #175 | Average 11.7% |
| Immigrants | Western Africa | 47.5 /100 | #176 | Average 11.7% |
| Immigrants | Central America | 46.6 /100 | #177 | Average 11.7% |
| Greeks | 46.2 /100 | #178 | Average 11.7% |
| Immigrants | Armenia | 41.9 /100 | #179 | Average 11.7% |