Canadian vs Inupiat Divorced or Separated
COMPARE
Canadian
Inupiat
Divorced or Separated
Divorced or Separated Comparison
Canadians
Inupiat
12.4%
DIVORCED OR SEPARATED
5.3/ 100
METRIC RATING
232nd/ 347
METRIC RANK
11.4%
DIVORCED OR SEPARATED
99.8/ 100
METRIC RATING
66th/ 347
METRIC RANK
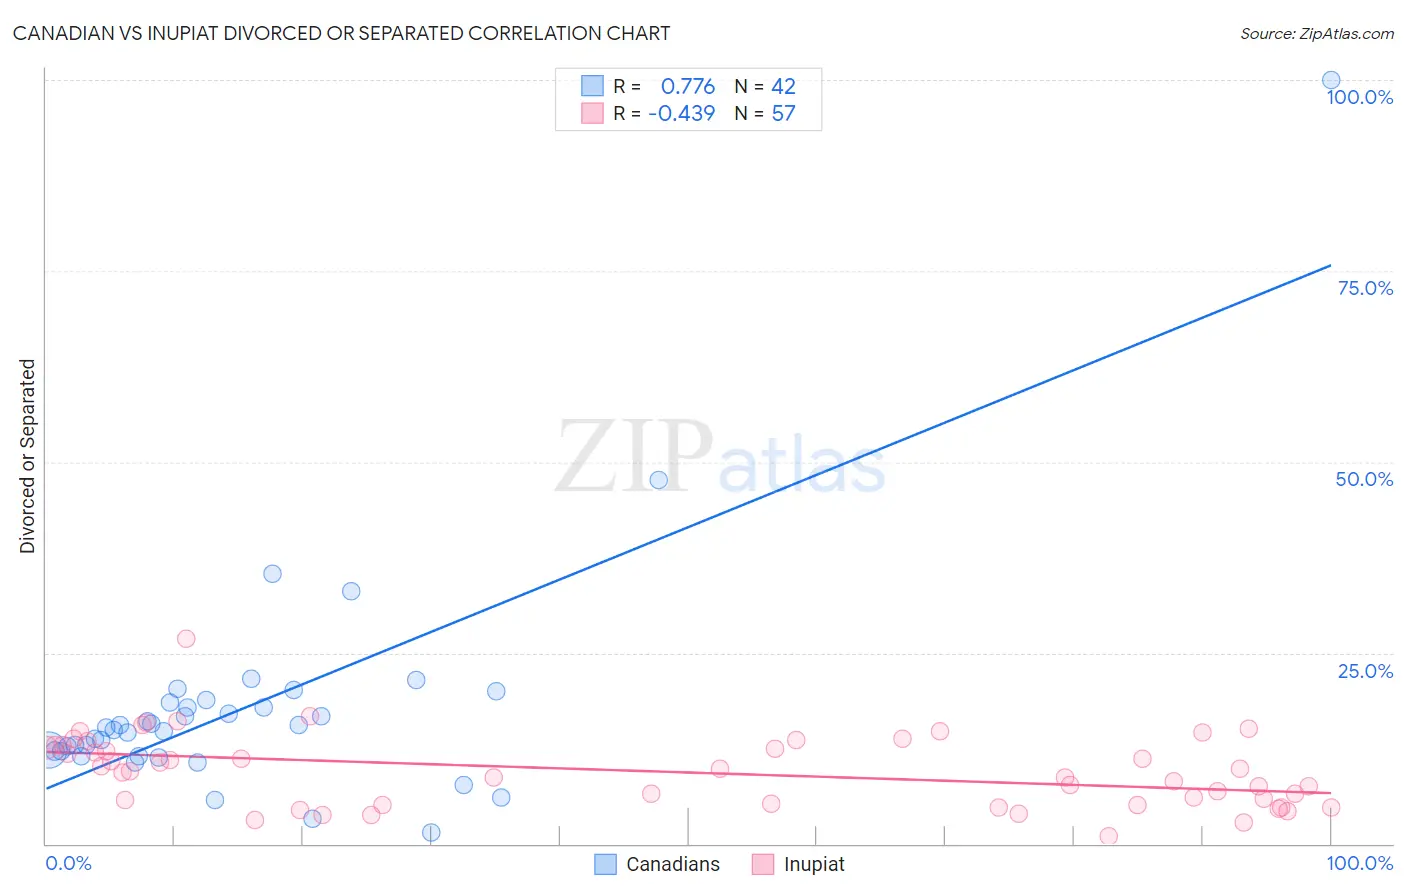
Canadian vs Inupiat Divorced or Separated Correlation Chart
The statistical analysis conducted on geographies consisting of 437,381,276 people shows a strong positive correlation between the proportion of Canadians and percentage of population currently divorced or separated in the United States with a correlation coefficient (R) of 0.776 and weighted average of 12.4%. Similarly, the statistical analysis conducted on geographies consisting of 96,343,887 people shows a moderate negative correlation between the proportion of Inupiat and percentage of population currently divorced or separated in the United States with a correlation coefficient (R) of -0.439 and weighted average of 11.4%, a difference of 8.1%.
Divorced or Separated Correlation Summary
| Measurement | Canadian | Inupiat |
| Minimum | 1.4% | 1.0% |
| Maximum | 100.0% | 26.8% |
| Range | 98.6% | 25.8% |
| Mean | 17.8% | 9.5% |
| Median | 15.1% | 9.6% |
| Interquartile 25% (IQ1) | 12.1% | 5.2% |
| Interquartile 75% (IQ3) | 18.4% | 13.0% |
| Interquartile Range (IQR) | 6.3% | 7.8% |
| Standard Deviation (Sample) | 15.3% | 4.7% |
| Standard Deviation (Population) | 15.1% | 4.7% |
Similar Demographics by Divorced or Separated
Demographics Similar to Canadians by Divorced or Separated
In terms of divorced or separated, the demographic groups most similar to Canadians are Malaysian (12.4%, a difference of 0.090%), West Indian (12.4%, a difference of 0.17%), Yugoslavian (12.3%, a difference of 0.19%), Immigrants from Bosnia and Herzegovina (12.4%, a difference of 0.19%), and Colombian (12.4%, a difference of 0.21%).
| Demographics | Rating | Rank | Divorced or Separated |
| Belgians | 9.7 /100 | #225 | Tragic 12.3% |
| Immigrants | Western Africa | 9.3 /100 | #226 | Tragic 12.3% |
| Hmong | 8.8 /100 | #227 | Tragic 12.3% |
| Immigrants | Cameroon | 8.3 /100 | #228 | Tragic 12.3% |
| Immigrants | Sudan | 8.2 /100 | #229 | Tragic 12.3% |
| Yakama | 7.8 /100 | #230 | Tragic 12.3% |
| Yugoslavians | 6.6 /100 | #231 | Tragic 12.3% |
| Canadians | 5.3 /100 | #232 | Tragic 12.4% |
| Malaysians | 4.8 /100 | #233 | Tragic 12.4% |
| West Indians | 4.4 /100 | #234 | Tragic 12.4% |
| Immigrants | Bosnia and Herzegovina | 4.3 /100 | #235 | Tragic 12.4% |
| Colombians | 4.2 /100 | #236 | Tragic 12.4% |
| Immigrants | Laos | 4.2 /100 | #237 | Tragic 12.4% |
| Sudanese | 4.0 /100 | #238 | Tragic 12.4% |
| Immigrants | Germany | 4.0 /100 | #239 | Tragic 12.4% |
Demographics Similar to Inupiat by Divorced or Separated
In terms of divorced or separated, the demographic groups most similar to Inupiat are Immigrants from Syria (11.4%, a difference of 0.090%), Immigrants from South Eastern Asia (11.4%, a difference of 0.14%), Macedonian (11.4%, a difference of 0.18%), Palestinian (11.5%, a difference of 0.20%), and Immigrants from Belgium (11.5%, a difference of 0.21%).
| Demographics | Rating | Rank | Divorced or Separated |
| Israelis | 99.9 /100 | #59 | Exceptional 11.3% |
| Immigrants | Russia | 99.9 /100 | #60 | Exceptional 11.3% |
| Koreans | 99.9 /100 | #61 | Exceptional 11.3% |
| Luxembourgers | 99.9 /100 | #62 | Exceptional 11.3% |
| Immigrants | Kuwait | 99.9 /100 | #63 | Exceptional 11.3% |
| Macedonians | 99.8 /100 | #64 | Exceptional 11.4% |
| Immigrants | South Eastern Asia | 99.8 /100 | #65 | Exceptional 11.4% |
| Inupiat | 99.8 /100 | #66 | Exceptional 11.4% |
| Immigrants | Syria | 99.7 /100 | #67 | Exceptional 11.4% |
| Palestinians | 99.7 /100 | #68 | Exceptional 11.5% |
| Immigrants | Belgium | 99.7 /100 | #69 | Exceptional 11.5% |
| Immigrants | Eastern Europe | 99.7 /100 | #70 | Exceptional 11.5% |
| Paraguayans | 99.7 /100 | #71 | Exceptional 11.5% |
| Jordanians | 99.6 /100 | #72 | Exceptional 11.5% |
| Immigrants | North Macedonia | 99.6 /100 | #73 | Exceptional 11.5% |