British vs Pennsylvania German Male Disability
COMPARE
British
Pennsylvania German
Male Disability
Male Disability Comparison
British
Pennsylvania Germans
12.1%
MALE DISABILITY
0.4/ 100
METRIC RATING
254th/ 347
METRIC RANK
13.0%
MALE DISABILITY
0.0/ 100
METRIC RATING
298th/ 347
METRIC RANK
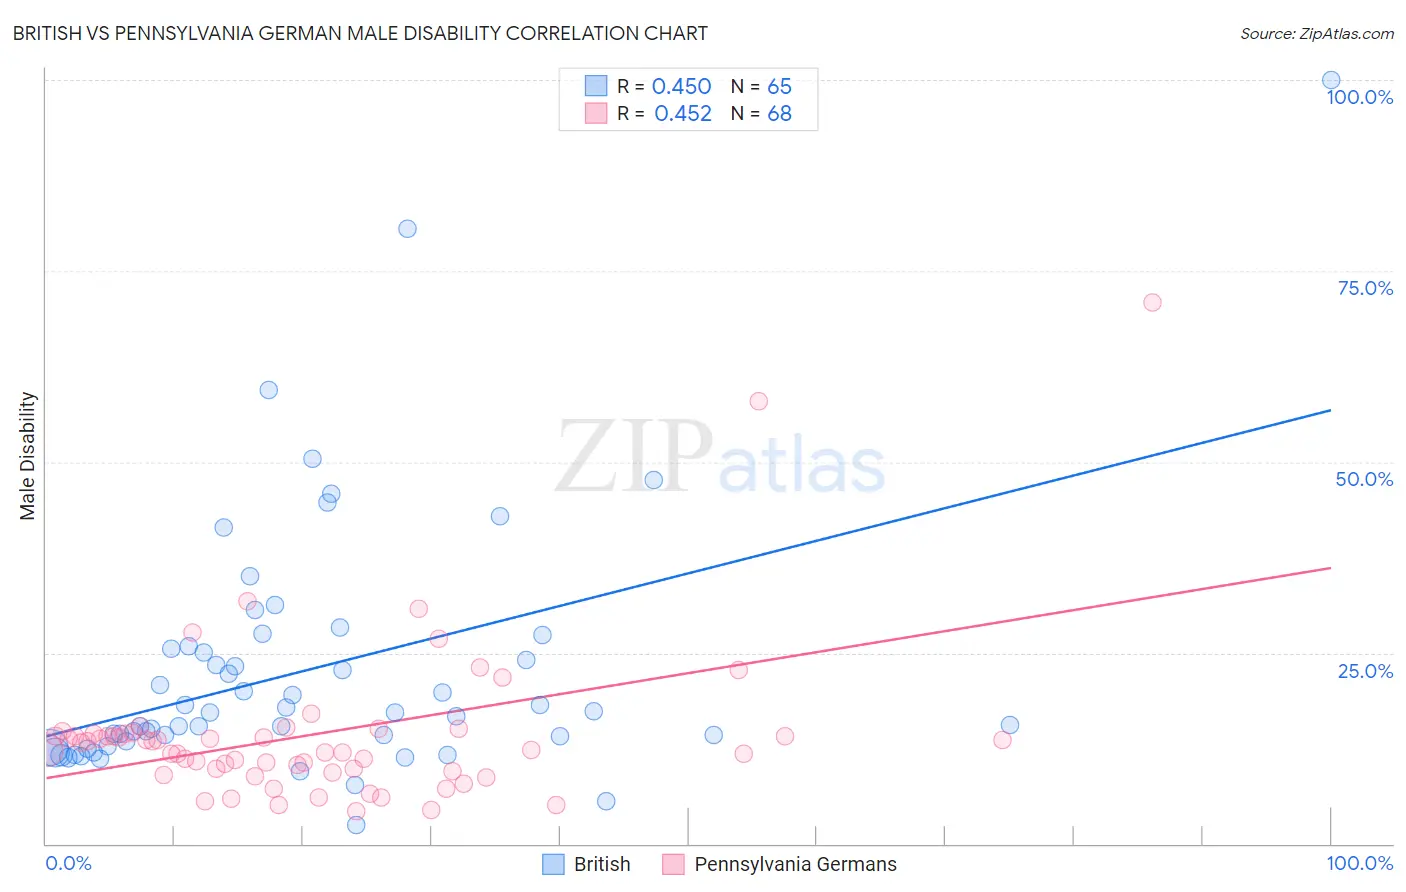
British vs Pennsylvania German Male Disability Correlation Chart
The statistical analysis conducted on geographies consisting of 531,329,993 people shows a moderate positive correlation between the proportion of British and percentage of males with a disability in the United States with a correlation coefficient (R) of 0.450 and weighted average of 12.1%. Similarly, the statistical analysis conducted on geographies consisting of 234,089,668 people shows a moderate positive correlation between the proportion of Pennsylvania Germans and percentage of males with a disability in the United States with a correlation coefficient (R) of 0.452 and weighted average of 13.0%, a difference of 7.6%.
Male Disability Correlation Summary
| Measurement | British | Pennsylvania German |
| Minimum | 2.5% | 4.3% |
| Maximum | 100.0% | 70.8% |
| Range | 97.5% | 66.6% |
| Mean | 22.7% | 14.3% |
| Median | 17.1% | 12.8% |
| Interquartile 25% (IQ1) | 13.2% | 9.6% |
| Interquartile 75% (IQ3) | 25.7% | 14.4% |
| Interquartile Range (IQR) | 12.5% | 4.8% |
| Standard Deviation (Sample) | 16.7% | 10.5% |
| Standard Deviation (Population) | 16.6% | 10.4% |
Similar Demographics by Male Disability
Demographics Similar to British by Male Disability
In terms of male disability, the demographic groups most similar to British are Chinese (12.1%, a difference of 0.010%), Guamanian/Chamorro (12.0%, a difference of 0.18%), Slovene (12.0%, a difference of 0.19%), German Russian (12.0%, a difference of 0.26%), and Swiss (12.1%, a difference of 0.26%).
| Demographics | Rating | Rank | Male Disability |
| Hungarians | 0.8 /100 | #247 | Tragic 12.0% |
| Poles | 0.7 /100 | #248 | Tragic 12.0% |
| Immigrants | Yemen | 0.5 /100 | #249 | Tragic 12.0% |
| Bangladeshis | 0.5 /100 | #250 | Tragic 12.0% |
| German Russians | 0.5 /100 | #251 | Tragic 12.0% |
| Slovenes | 0.5 /100 | #252 | Tragic 12.0% |
| Guamanians/Chamorros | 0.5 /100 | #253 | Tragic 12.0% |
| British | 0.4 /100 | #254 | Tragic 12.1% |
| Chinese | 0.4 /100 | #255 | Tragic 12.1% |
| Swiss | 0.3 /100 | #256 | Tragic 12.1% |
| Europeans | 0.3 /100 | #257 | Tragic 12.1% |
| Basques | 0.3 /100 | #258 | Tragic 12.1% |
| Belgians | 0.3 /100 | #259 | Tragic 12.1% |
| Swedes | 0.3 /100 | #260 | Tragic 12.1% |
| Slavs | 0.2 /100 | #261 | Tragic 12.2% |
Demographics Similar to Pennsylvania Germans by Male Disability
In terms of male disability, the demographic groups most similar to Pennsylvania Germans are Inupiat (13.0%, a difference of 0.20%), Nonimmigrants (12.9%, a difference of 0.31%), Celtic (13.0%, a difference of 0.35%), Immigrants from Micronesia (12.9%, a difference of 0.37%), and Cheyenne (13.0%, a difference of 0.44%).
| Demographics | Rating | Rank | Male Disability |
| Whites/Caucasians | 0.0 /100 | #291 | Tragic 12.8% |
| English | 0.0 /100 | #292 | Tragic 12.8% |
| Yaqui | 0.0 /100 | #293 | Tragic 12.9% |
| Marshallese | 0.0 /100 | #294 | Tragic 12.9% |
| Immigrants | Micronesia | 0.0 /100 | #295 | Tragic 12.9% |
| Immigrants | Nonimmigrants | 0.0 /100 | #296 | Tragic 12.9% |
| Inupiat | 0.0 /100 | #297 | Tragic 13.0% |
| Pennsylvania Germans | 0.0 /100 | #298 | Tragic 13.0% |
| Celtics | 0.0 /100 | #299 | Tragic 13.0% |
| Cheyenne | 0.0 /100 | #300 | Tragic 13.0% |
| French | 0.0 /100 | #301 | Tragic 13.0% |
| Crow | 0.0 /100 | #302 | Tragic 13.1% |
| Scotch-Irish | 0.0 /100 | #303 | Tragic 13.2% |
| Blacks/African Americans | 0.0 /100 | #304 | Tragic 13.2% |
| French Canadians | 0.0 /100 | #305 | Tragic 13.3% |