Immigrants from Eastern Europe vs Pennsylvania German Male Disability
COMPARE
Immigrants from Eastern Europe
Pennsylvania German
Male Disability
Male Disability Comparison
Immigrants from Eastern Europe
Pennsylvania Germans
10.7%
MALE DISABILITY
95.3/ 100
METRIC RATING
102nd/ 347
METRIC RANK
13.0%
MALE DISABILITY
0.0/ 100
METRIC RATING
298th/ 347
METRIC RANK
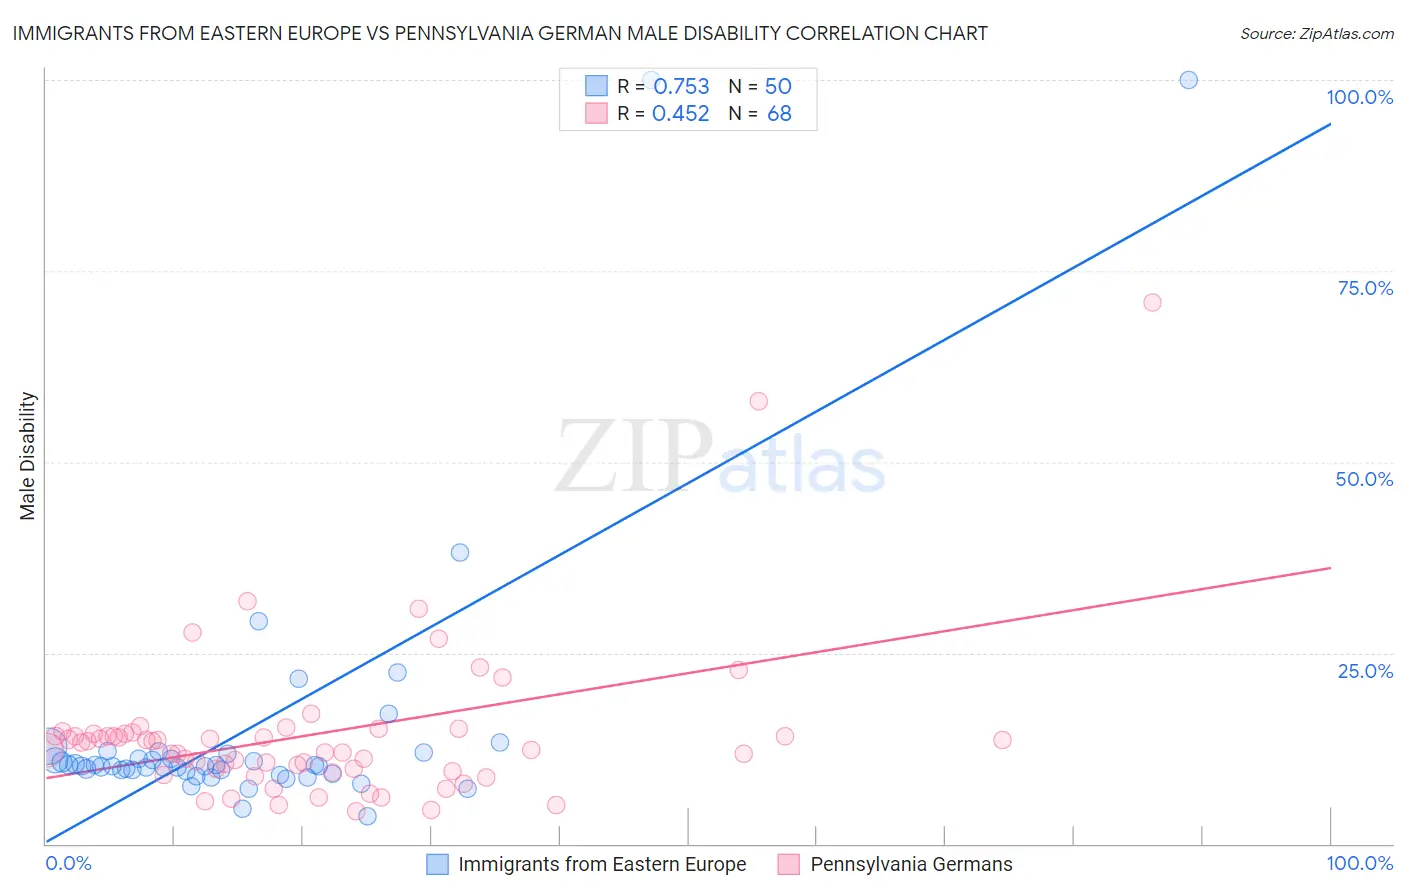
Immigrants from Eastern Europe vs Pennsylvania German Male Disability Correlation Chart
The statistical analysis conducted on geographies consisting of 475,764,615 people shows a strong positive correlation between the proportion of Immigrants from Eastern Europe and percentage of males with a disability in the United States with a correlation coefficient (R) of 0.753 and weighted average of 10.7%. Similarly, the statistical analysis conducted on geographies consisting of 234,089,668 people shows a moderate positive correlation between the proportion of Pennsylvania Germans and percentage of males with a disability in the United States with a correlation coefficient (R) of 0.452 and weighted average of 13.0%, a difference of 20.7%.
Male Disability Correlation Summary
| Measurement | Immigrants from Eastern Europe | Pennsylvania German |
| Minimum | 3.6% | 4.3% |
| Maximum | 100.0% | 70.8% |
| Range | 96.4% | 66.6% |
| Mean | 15.0% | 14.3% |
| Median | 10.2% | 12.8% |
| Interquartile 25% (IQ1) | 9.6% | 9.6% |
| Interquartile 75% (IQ3) | 11.8% | 14.4% |
| Interquartile Range (IQR) | 2.3% | 4.8% |
| Standard Deviation (Sample) | 18.4% | 10.5% |
| Standard Deviation (Population) | 18.2% | 10.4% |
Similar Demographics by Male Disability
Demographics Similar to Immigrants from Eastern Europe by Male Disability
In terms of male disability, the demographic groups most similar to Immigrants from Eastern Europe are Uruguayan (10.7%, a difference of 0.010%), Immigrants from Nigeria (10.8%, a difference of 0.080%), Immigrants from Brazil (10.8%, a difference of 0.090%), Immigrants from Greece (10.7%, a difference of 0.10%), and Immigrants from Syria (10.8%, a difference of 0.13%).
| Demographics | Rating | Rank | Male Disability |
| Chileans | 96.9 /100 | #95 | Exceptional 10.7% |
| Nicaraguans | 96.6 /100 | #96 | Exceptional 10.7% |
| Immigrants | Armenia | 96.6 /100 | #97 | Exceptional 10.7% |
| Immigrants | Romania | 96.5 /100 | #98 | Exceptional 10.7% |
| Immigrants | Switzerland | 96.1 /100 | #99 | Exceptional 10.7% |
| Immigrants | Kazakhstan | 95.9 /100 | #100 | Exceptional 10.7% |
| Immigrants | Greece | 95.6 /100 | #101 | Exceptional 10.7% |
| Immigrants | Eastern Europe | 95.3 /100 | #102 | Exceptional 10.7% |
| Uruguayans | 95.3 /100 | #103 | Exceptional 10.7% |
| Immigrants | Nigeria | 95.1 /100 | #104 | Exceptional 10.8% |
| Immigrants | Brazil | 95.0 /100 | #105 | Exceptional 10.8% |
| Immigrants | Syria | 94.9 /100 | #106 | Exceptional 10.8% |
| Immigrants | Eastern Africa | 94.3 /100 | #107 | Exceptional 10.8% |
| Immigrants | Belgium | 94.2 /100 | #108 | Exceptional 10.8% |
| Immigrants | Uganda | 94.0 /100 | #109 | Exceptional 10.8% |
Demographics Similar to Pennsylvania Germans by Male Disability
In terms of male disability, the demographic groups most similar to Pennsylvania Germans are Inupiat (13.0%, a difference of 0.20%), Nonimmigrants (12.9%, a difference of 0.31%), Celtic (13.0%, a difference of 0.35%), Immigrants from Micronesia (12.9%, a difference of 0.37%), and Cheyenne (13.0%, a difference of 0.44%).
| Demographics | Rating | Rank | Male Disability |
| Whites/Caucasians | 0.0 /100 | #291 | Tragic 12.8% |
| English | 0.0 /100 | #292 | Tragic 12.8% |
| Yaqui | 0.0 /100 | #293 | Tragic 12.9% |
| Marshallese | 0.0 /100 | #294 | Tragic 12.9% |
| Immigrants | Micronesia | 0.0 /100 | #295 | Tragic 12.9% |
| Immigrants | Nonimmigrants | 0.0 /100 | #296 | Tragic 12.9% |
| Inupiat | 0.0 /100 | #297 | Tragic 13.0% |
| Pennsylvania Germans | 0.0 /100 | #298 | Tragic 13.0% |
| Celtics | 0.0 /100 | #299 | Tragic 13.0% |
| Cheyenne | 0.0 /100 | #300 | Tragic 13.0% |
| French | 0.0 /100 | #301 | Tragic 13.0% |
| Crow | 0.0 /100 | #302 | Tragic 13.1% |
| Scotch-Irish | 0.0 /100 | #303 | Tragic 13.2% |
| Blacks/African Americans | 0.0 /100 | #304 | Tragic 13.2% |
| French Canadians | 0.0 /100 | #305 | Tragic 13.3% |