British vs Immigrants from Senegal Male Disability
COMPARE
British
Immigrants from Senegal
Male Disability
Male Disability Comparison
British
Immigrants from Senegal
12.1%
MALE DISABILITY
0.4/ 100
METRIC RATING
254th/ 347
METRIC RANK
11.3%
MALE DISABILITY
34.4/ 100
METRIC RATING
181st/ 347
METRIC RANK
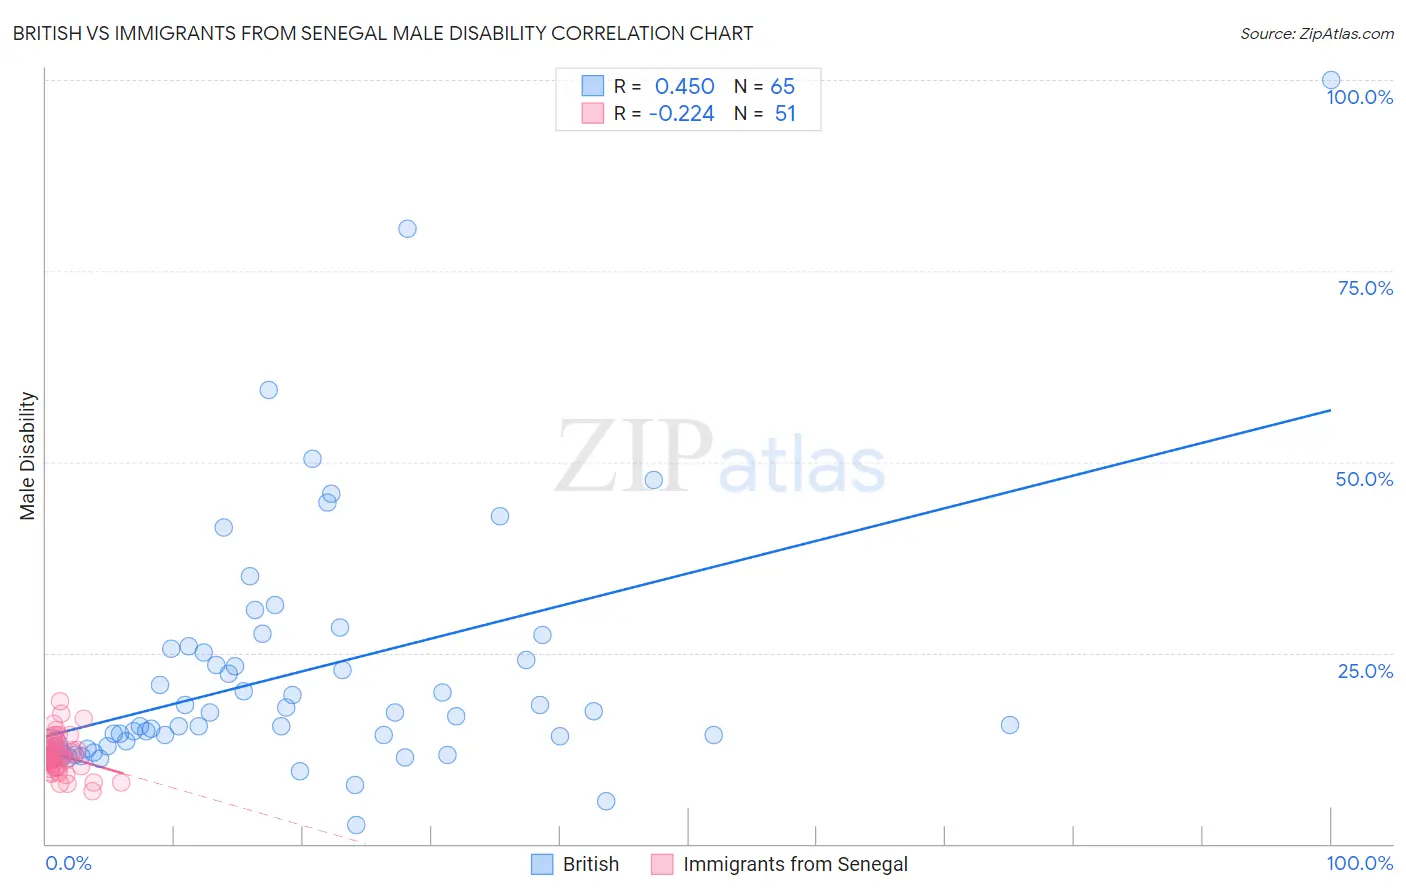
British vs Immigrants from Senegal Male Disability Correlation Chart
The statistical analysis conducted on geographies consisting of 531,329,993 people shows a moderate positive correlation between the proportion of British and percentage of males with a disability in the United States with a correlation coefficient (R) of 0.450 and weighted average of 12.1%. Similarly, the statistical analysis conducted on geographies consisting of 90,127,503 people shows a weak negative correlation between the proportion of Immigrants from Senegal and percentage of males with a disability in the United States with a correlation coefficient (R) of -0.224 and weighted average of 11.3%, a difference of 6.6%.
Male Disability Correlation Summary
| Measurement | British | Immigrants from Senegal |
| Minimum | 2.5% | 6.9% |
| Maximum | 100.0% | 18.7% |
| Range | 97.5% | 11.8% |
| Mean | 22.7% | 11.6% |
| Median | 17.1% | 11.4% |
| Interquartile 25% (IQ1) | 13.2% | 10.0% |
| Interquartile 75% (IQ3) | 25.7% | 12.6% |
| Interquartile Range (IQR) | 12.5% | 2.6% |
| Standard Deviation (Sample) | 16.7% | 2.4% |
| Standard Deviation (Population) | 16.6% | 2.4% |
Similar Demographics by Male Disability
Demographics Similar to British by Male Disability
In terms of male disability, the demographic groups most similar to British are Chinese (12.1%, a difference of 0.010%), Guamanian/Chamorro (12.0%, a difference of 0.18%), Slovene (12.0%, a difference of 0.19%), German Russian (12.0%, a difference of 0.26%), and Swiss (12.1%, a difference of 0.26%).
| Demographics | Rating | Rank | Male Disability |
| Hungarians | 0.8 /100 | #247 | Tragic 12.0% |
| Poles | 0.7 /100 | #248 | Tragic 12.0% |
| Immigrants | Yemen | 0.5 /100 | #249 | Tragic 12.0% |
| Bangladeshis | 0.5 /100 | #250 | Tragic 12.0% |
| German Russians | 0.5 /100 | #251 | Tragic 12.0% |
| Slovenes | 0.5 /100 | #252 | Tragic 12.0% |
| Guamanians/Chamorros | 0.5 /100 | #253 | Tragic 12.0% |
| British | 0.4 /100 | #254 | Tragic 12.1% |
| Chinese | 0.4 /100 | #255 | Tragic 12.1% |
| Swiss | 0.3 /100 | #256 | Tragic 12.1% |
| Europeans | 0.3 /100 | #257 | Tragic 12.1% |
| Basques | 0.3 /100 | #258 | Tragic 12.1% |
| Belgians | 0.3 /100 | #259 | Tragic 12.1% |
| Swedes | 0.3 /100 | #260 | Tragic 12.1% |
| Slavs | 0.2 /100 | #261 | Tragic 12.2% |
Demographics Similar to Immigrants from Senegal by Male Disability
In terms of male disability, the demographic groups most similar to Immigrants from Senegal are Immigrants from Belize (11.3%, a difference of 0.040%), Immigrants from Central America (11.3%, a difference of 0.090%), Iraqi (11.3%, a difference of 0.24%), Pakistani (11.3%, a difference of 0.25%), and Honduran (11.3%, a difference of 0.40%).
| Demographics | Rating | Rank | Male Disability |
| Maltese | 50.0 /100 | #174 | Average 11.2% |
| Immigrants | Honduras | 48.7 /100 | #175 | Average 11.2% |
| Syrians | 46.6 /100 | #176 | Average 11.2% |
| Immigrants | Norway | 44.2 /100 | #177 | Average 11.3% |
| Australians | 42.2 /100 | #178 | Average 11.3% |
| Immigrants | Caribbean | 41.4 /100 | #179 | Average 11.3% |
| Hondurans | 41.1 /100 | #180 | Average 11.3% |
| Immigrants | Senegal | 34.4 /100 | #181 | Fair 11.3% |
| Immigrants | Belize | 33.7 /100 | #182 | Fair 11.3% |
| Immigrants | Central America | 32.9 /100 | #183 | Fair 11.3% |
| Iraqis | 30.5 /100 | #184 | Fair 11.3% |
| Pakistanis | 30.3 /100 | #185 | Fair 11.3% |
| Immigrants | Zaire | 27.6 /100 | #186 | Fair 11.4% |
| Immigrants | Austria | 27.3 /100 | #187 | Fair 11.4% |
| Estonians | 26.8 /100 | #188 | Fair 11.4% |